Using Graphs and Plotting Them from Rules
Graphing Functions Defined by Rules
Functions given as rules, such as \(f(x)=x^2-2x+3\) can be graphed by plugging in variety of \(x\)-values in order to get corresponding \(y\)-values, then plotting them on an \(xy\)-graph, connecting the points with a smooth curve to interpolate the values of the graph between the points you found. It is often helpful to create a table with the first column representing \(x\)-values, and the second column representing \(y\)-values. This is exhibited in the images below.
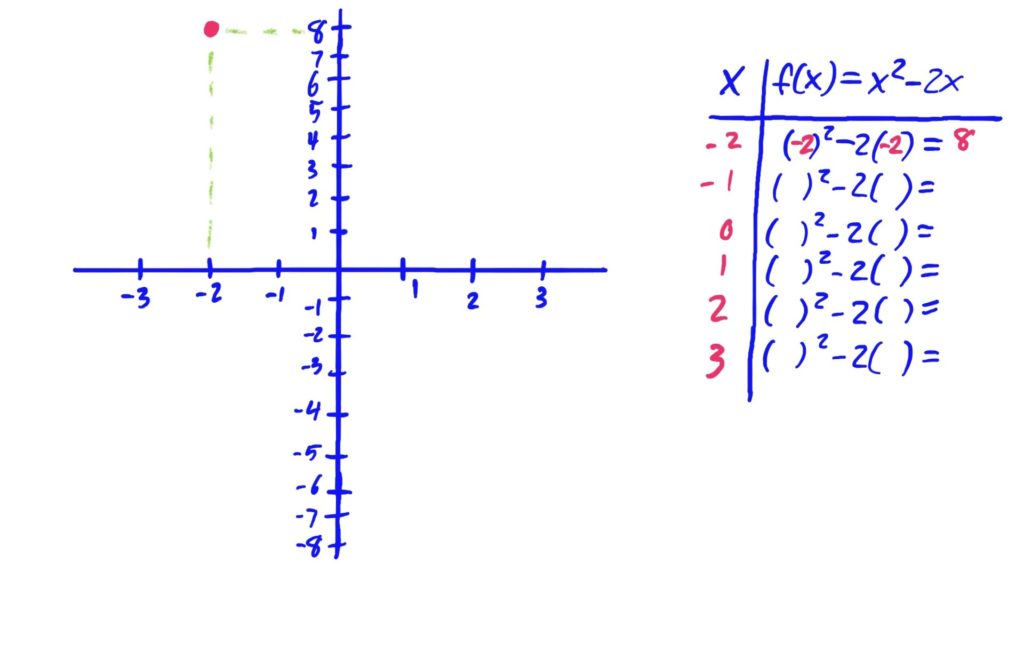
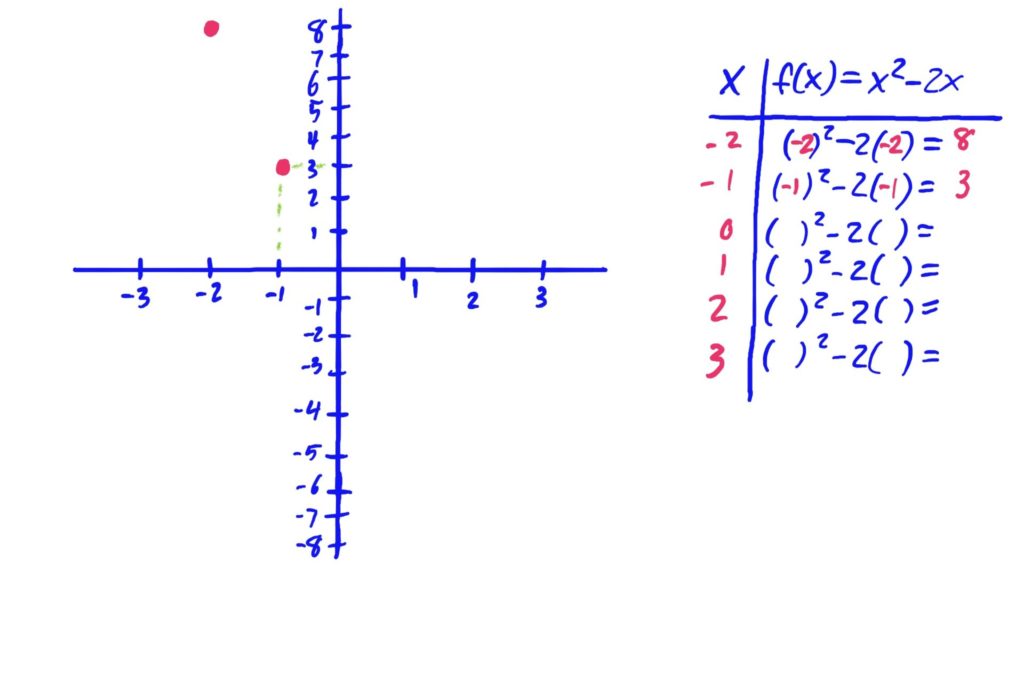
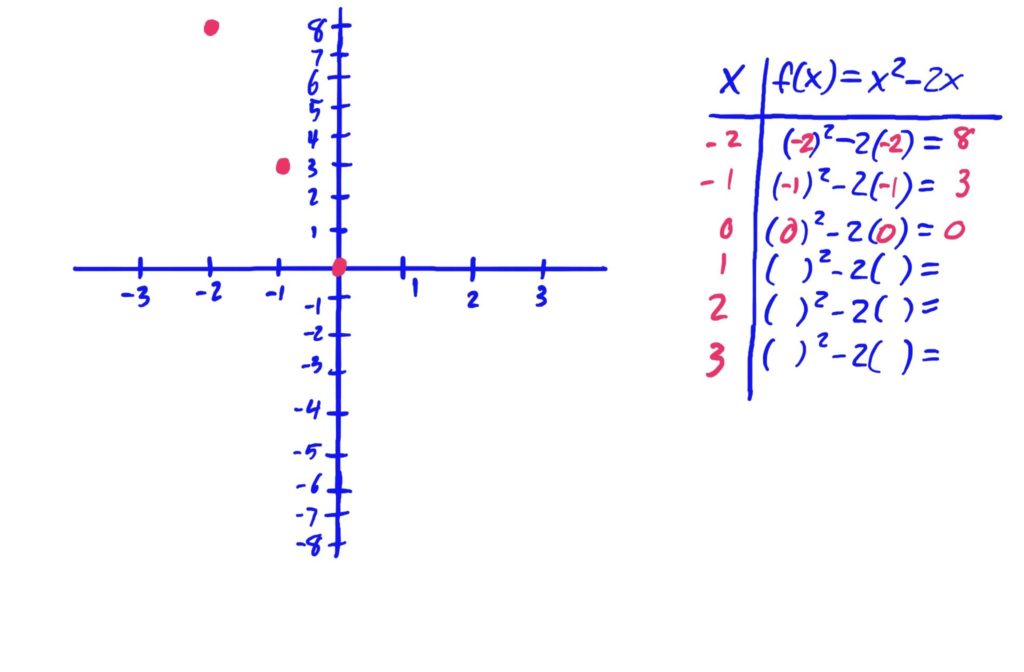
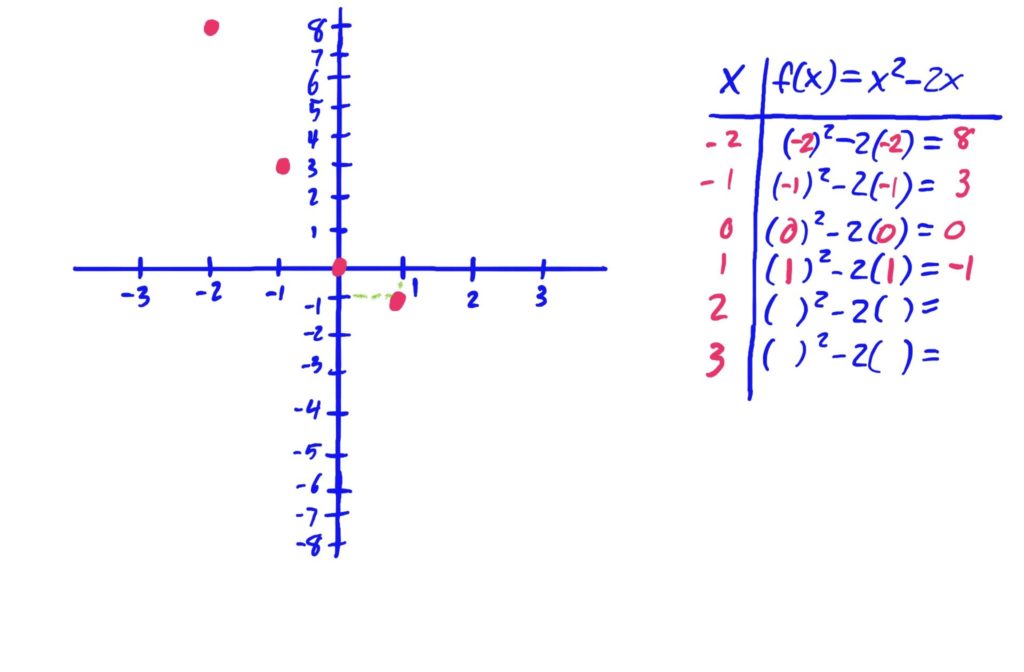
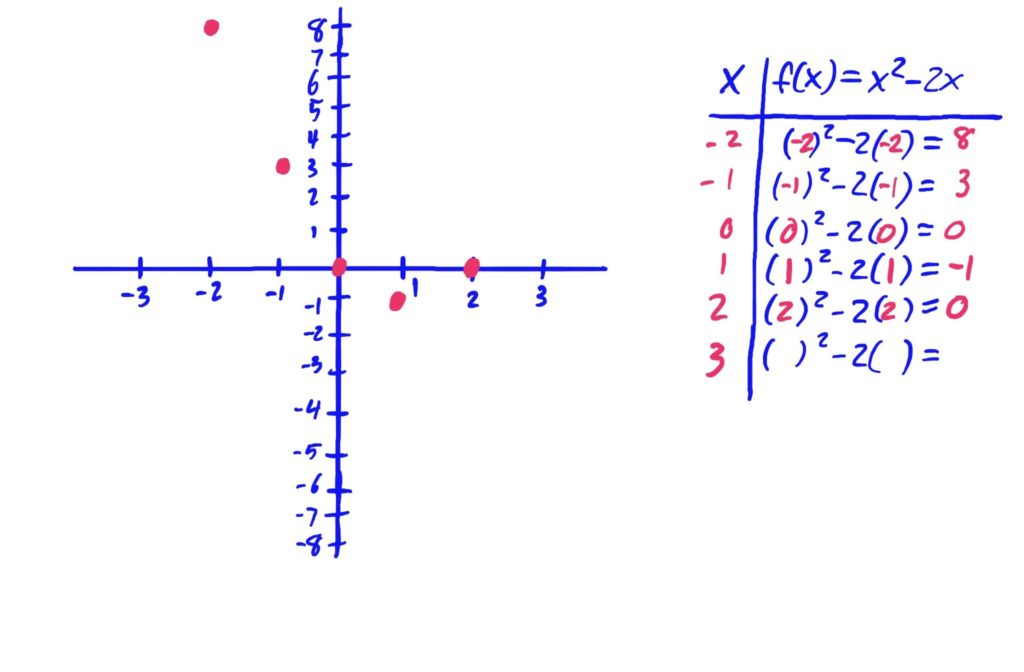
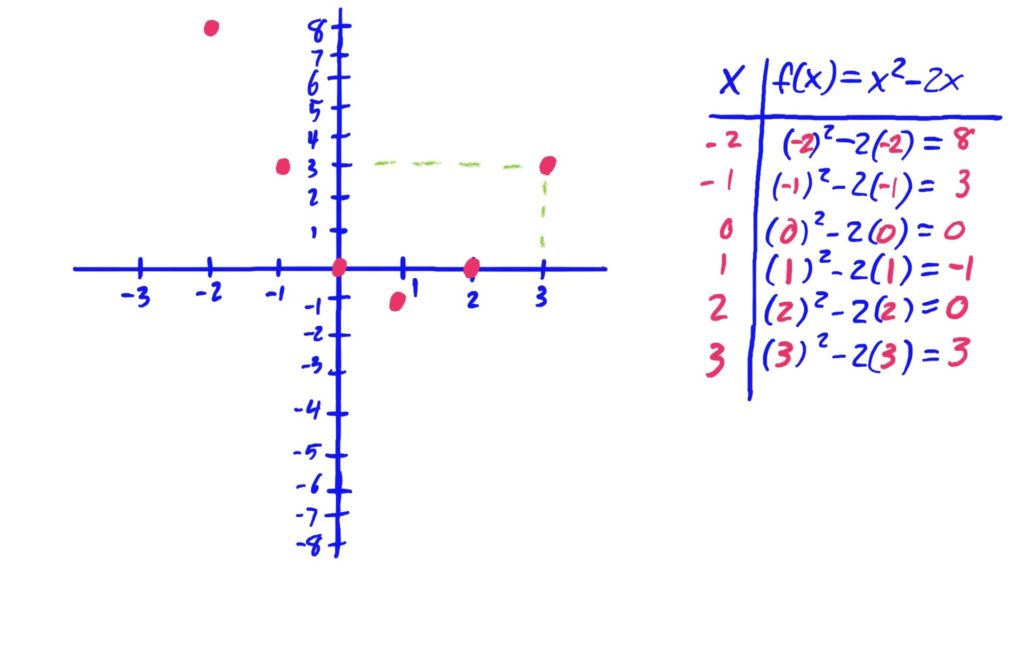
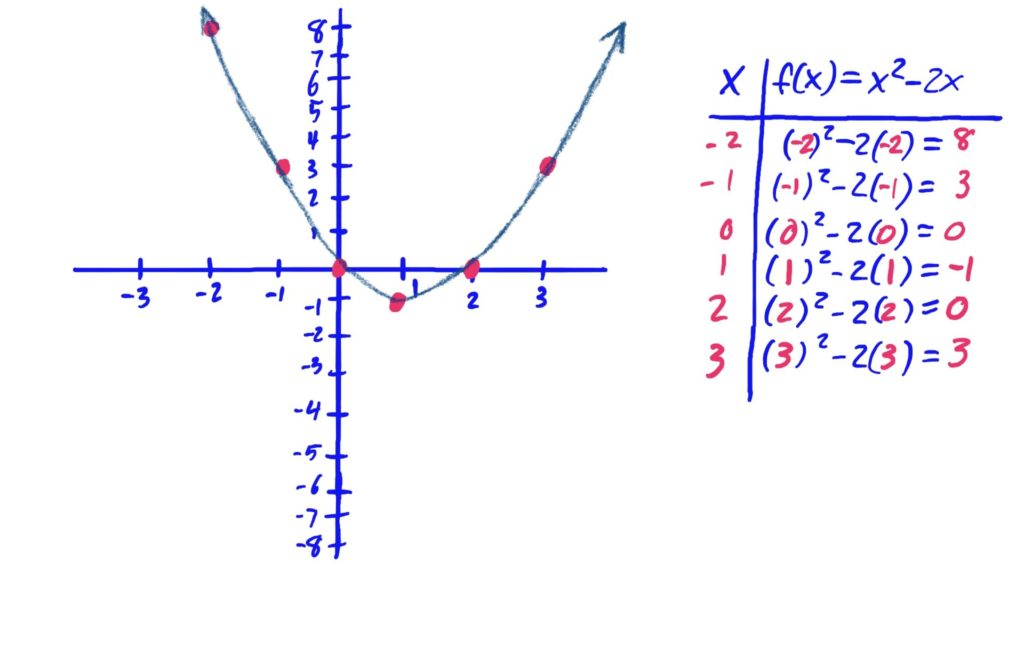
After plotting points, it is helpful to draw your curve so that it is smooth, and has no hard corners (unless you know the function actually has a hard corner at some \(x\)-value). Be sure to also include arrows at the ends of your curve if your graph needs to run off the page in any direction. The arrows indicate that the graph keeps going in that general direction.
Using Graphs to Evaluate Function Values at Specific Input Values
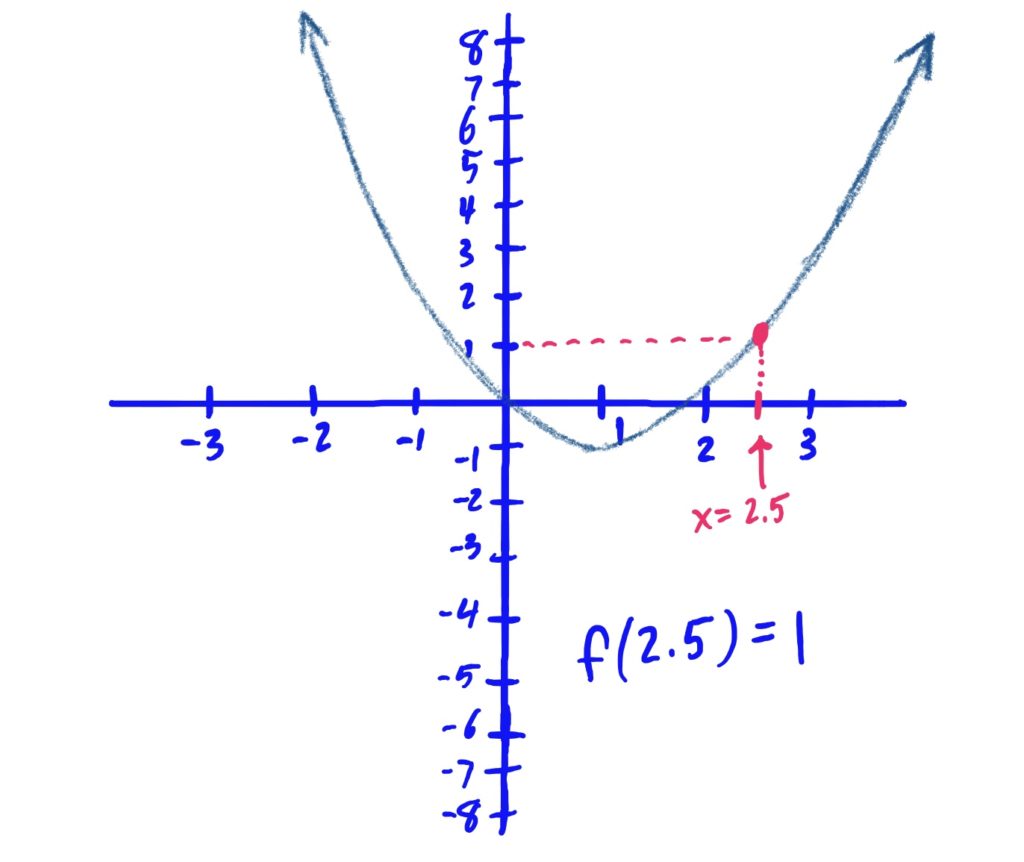
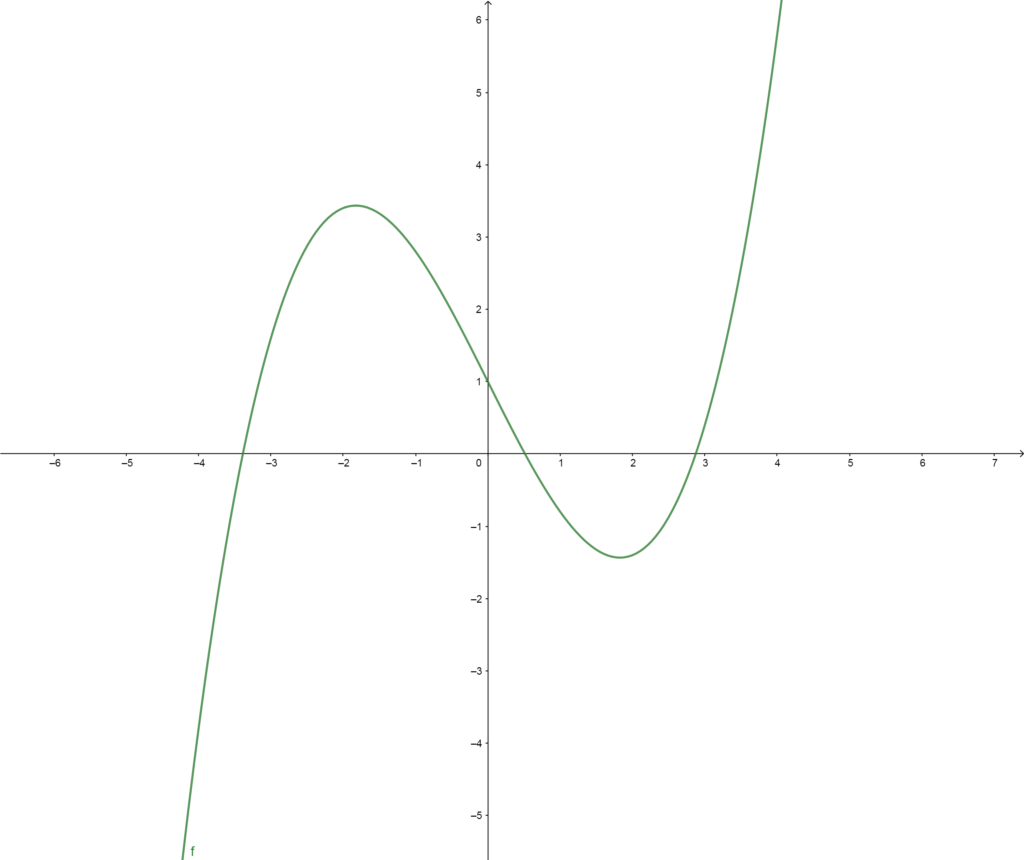
One can use the graph of a function to determine the output of the function given a specific input \(x\)-value. The output of a function on a certain input can be found by looking for the \(y\)-value that the graph is touching above the given \(x\)-value.
For instance, in the graph of a function \(f\) below, one can compute \(f(2.5)\) by looking for \(x=2.5\) on the \(x\)-axis (it is not labeled, but \(x=2.5\) still lives halfway between the labeled points \(2\) and \(3\)), and then draw a dashed line straight up until they intersect the graphed curve (and shade the intersection point). The output of the function at this point is the \(y\)-value of this intersection point. The image below shows this in action.

Solution: Note that these answers are estimates and may differ a bit from your final answers
\(g(-0.5)=0.83\)
\(g(1.20)=1.8\)
\(g(0.14)=0.95\)

Solution: (Note these are estimates. Your answers might be slightly different)
\(f(-1)=2.75\)
\(f(3)=0.5\)
\(f(4)=7\)
