Guessing Limits Using Tables
Guessing Limits of Functions Defined by Rules Using Tables
Suppose we are given a function defined by a rule instead of a graph such as
$$f(x)=\frac{x^2+2x+1}{x+1}$$
Notice that \(f(-1)\) is not defined because when you plug \(x=-1\) into the rule, the denominator is equal to \(0\) which gives us division by zero… which is bad/undefined. It very well may be the case that we simply have a “hole” in our function at \(x=-1\) much like what we’ve seen before. To make this determination, we need to see if the two-sided limit exists at \(x=-1\). However, without having the graph of the function handy, how can we go about this? (because there are some functions that you can’t have a calculator graph nicely for you, such as piecewise functions)
We show this method in action in the example below, which uses the function we introduced earlier.
Let’s start with our left-hand limit table. See below. Note that since we are trying to compute \(\lim_{x\rightarrow -1^-} f(x)\) (i.e. the left-and limit) we want to choose \(x\)-values that are slightly less than \(x=-1\) and that also get closer to \(x=-1\) as you read down the table. Plug those into the rule and see where the \(y\)-values are going.
| \(x\) | \(y=\frac{x^2+2x+1}{x+1}\) |
| \(-1.1\) | \(-0.1\) |
| \(-1.01\) | \(-0.01\) |
| \(-1.001\) | \(-0.001\) |
| \(-1.0001\) | \(-0.0001\) |
It appears that as the \(x\)-values approach \(x=-1\) from the left, the \(y\)-values are getting closer and closer to \(y=0\) (from below; we are getting less and less negative), so that will be our guess for the left-hand limit of \(f\) as \(x\rightarrow -1\). That is:
$$\lim_{x\rightarrow -1^-}\frac{x^2+2x+1}{x+1}=0$$
Now, we do the same thing with the right-hand limit, but instead of plugging in \(x\)-values that are less than \(x=-1\), we plug in values that are larger than it, that are decreasing and getting closer to \(x=-1\). See the table below!
| \(x\) | \(y=\frac{x^2+2x+1}{x+1}\) |
| \(-0.9\) | \(0.1\) |
| \(-0.99\) | \(0.01\) |
| \(-0.999\) | \(0.001\) |
| \(-0.9999\) | \(0.0001\) |
As we can see, as \(x\rightarrow -1^+\), the \(y\)-values are decreasing, getting really tiny the closer the \(x\)-values get to \(x=-1\). So we would guess that the right-hand limit of \(f\) is also \(0\). Thus we would write
$$\lim_{x\rightarrow -1^+}\frac{x^2+2x+1}{x+1}=0$$
Since our guess for the right and left-hand limit are the same, we have a solid guess for the two-sided limit.
$$\lim_{x\rightarrow -1}\frac{x^2+2x+1}{x+1}=0$$
Why is it only a guess?
Why is it that we cannot simply use our tables to correctly determine a function’s limit at a given \(x\)-value? Simply put: because we might not be plugging in values close enough to the given \(x\)-value to know exactly what the function is doing incredibly close by.
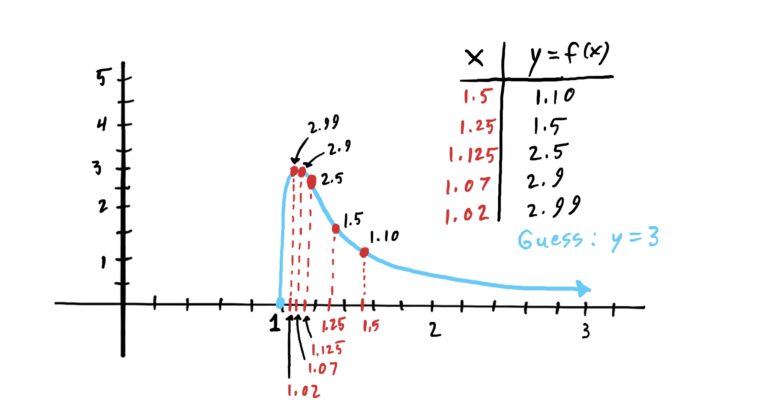
For instance, suppose we had a function like the one graphed below and we wanted to compute the right-hand limit at \(x=1\).

Notice that if we plugged in the five \(x\)-values you see, it would look like the \(y\)-values are headed toward \(y=3\). We would need to plug in a few more \(x\)-values that were even closer to \(x=1\) than the ones we chose to see that all the action is microns away from \(x=1\).
Without a graph, we would never have known that the function dives down so sharply. Moreover, we wouldn’t know exactly how close to \(x=1\) we’d need to choose our \(x\)-values to be so that we are not “tricked” into thinking the limit is \(3\) instead of \(0\). You would have to plug in an infinite number of \(x\)-values in order to not be “tricked” by the function. Hence, when using tables (or cutting to the chase and just plugging in a single number that is really close to the limit \(x\)-value instead of using tables) the best we can hope for is merely a guess.
Guess: \(\lim_{x\rightarrow -2} 3x^2+1=13\)
Guess: \(\lim_{x\rightarrow -2} \frac{x^2-4}{x+2}=-4\)
Guess: \(\lim_{x\rightarrow -1} \frac{x^2+3x+2}{x+1}=1\)
Guess: \(\lim_{x\rightarrow 0} f(x)\) DNE
Guess: \(\lim_{x\rightarrow 2} f(x)=4\)
Guess: \(\lim_{x\rightarrow 1} f(x)\) DNE
