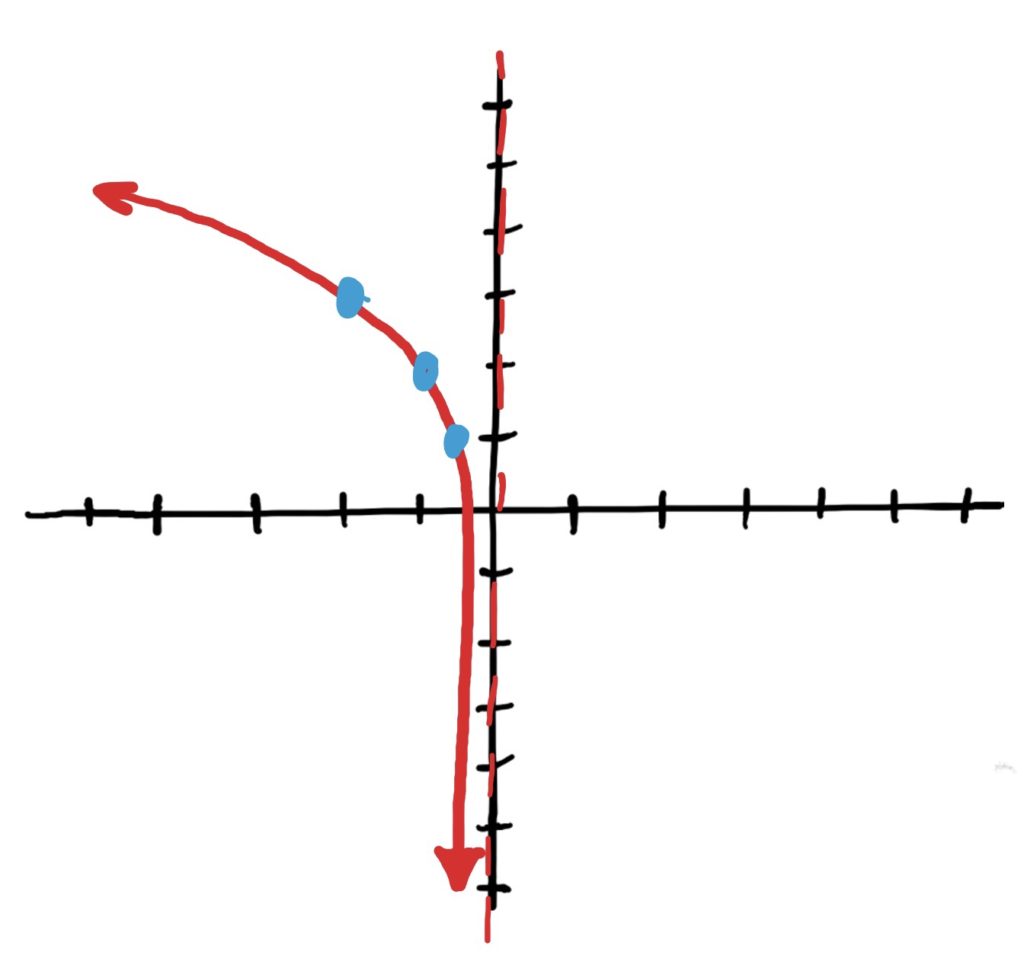
Graphing and Transforming Logarithmic Functions
Graphs of Logarithmic Functions
Because we can define functions using logarithms, and such functions are defined for all input \(x\)-values greater than \(0\), it only makes sense that we can graph logarithmic functions.
The graphs of logarithmic functions and their shape (along with locations of its “control points”) are entirely dictated by the base of the logarithmic function. Below we illustrate the key differences along with some of the key features of these two sorts of graphs. This will augment our library of functions considerably!

\(f(x)=\log_a(x)\) where \(a>1\)
Key Features:
- Has a concave-downward, rapidly-and-then-slowly increasing general shape you see at left (when the base \(a>1\)).
- The graph will NEVER cross the \(y\)-axis, but it will get as close as you like to it from the right as \(x\)-value inputs get closer and closer to zero. This gives a vertical asymptote at \(x=0\).
- As \(x\)-value inputs get bigger, the \(y\)-values slowly get bigger. It takes very large inputs to produce relatively small outputs.
- As the \(x\)-value inputs get smaller, the \(y\)-values decrease rapidly.
Control/Reference Points
The graph of \(f(x)=\log_a(x)\) passes through \((\frac{1}{a},-1)\), \((1,0)\), and \((a,1)\).
The graph at left shows the function \(f(x)=\log_2(x)\) which has control points \((\frac{1}{2},-1), (1,0),\) and \((2,1)\).
\(f(x)=\log_a(x)\) where \(a<1\)
Key Features:
- Has a concave-upward, rapidly-and-then-slowly decreasing general shape you see at right (when the base \(a<1\)).
- The graph will NEVER cross the \(y\)-axis, but it will get as close as you like to it from the right as \(x\)-value inputs get closer and closer to zero. This gives a vertical asymptote at \(x=0\).
- As \(x\)-value inputs get bigger, the \(y\)-values slowly get more and more negative. It takes very large inputs to produce relatively small negative outputs.
- As the \(x\)-value inputs get smaller (i.e. closer to zero), the \(y\)-values increase rapidly.
Control/Reference Points
The graph of \(f(x)=\log_a(x)\) passes through \((\frac{1}{a},-1)\), \((1,0)\), and \((a,1)\).
The graph at left shows the function \(f(x)=\log_{\frac{1}{2}}(x)\) which has control points \((\frac{1}{\frac{1}{2}},-1)=(2,-1), (1,0),\) and \((\frac{1}{2},1)\).

To reiterate the above, the graph and thus the control points used to graph a logarithm are determined by the base \(a\). It’s helpful to try listing the control points of various functions of the form \(f(x)=\log_a(x)\) for different \(a\)-values so that you see a pattern in how they are computed. Note that regardless of whether \(a>1\) or \(a<1\), the control points are calculated the same way. See below.
| Logarithmic Function | \(a\)-value (base) | Control Points: \((\frac{1}{a},-1)\), \((1,0)\), \((a,1)\) |
| \(f(x)=\log_\frac{1}{3}(x)\) | \(a=\frac{1}{3}\) | \((\frac{1}{a},-1)=(3,-1)\), \((1,0)\), \((a,1)=(\frac{1}{3},1)\) |
| \(f(x)=\log_{\frac{1}{2}}(x)\) | \(a=\frac{1}{2}\) | \((\frac{1}{a},-1)=(2,-1)\), \((1,0)\), \((a,1)=(\frac{1}{2},1)\) |
| \(f(x)=\log_\frac{2}{3}(x)\) | \(a=\frac{2}{3}\) | \((\frac{1}{a},-1)=(\frac{3}{2},-1)\) ,\((1,0)\), \((a,1)=(\frac{2}{3},1)\) |
| \(f(x)=2^x\) | \(a=2\) | \((\frac{1}{a},-1)=(\frac{1}{2},-1)\), \((1,0)\), \((a,1)=(2,1)\) |
| \(f(x)=\log_5(x)\) | \(a=5\) | \((\frac{1}{a},-1)=(\frac{1}{5},-1)\), \((1,0)\), \((a,1)=(5,1)\) |
Graphing Transformed Logarithmic Functions
Graphing transformed logarithmic functions works EXACTLY the same way as graphing any other sort of transformed function. Below are the steps for graphing these, which will look very familiar. We will demonstrate the steps below by considering the transformed logarithmic function
$$f(x)=3\log_2(-x+1)-2$$
In the function \(f(x)=3\log_2(-x+1)-2\), the simple logarithm that is being transformed is \(\log_2(x)\). All the other stuff are transformations being applied to this simple log function.
The control points of a simple logarithmic function are given by
$$\left(\frac{1}{a},-1\right), (1,0), (a,1)$$
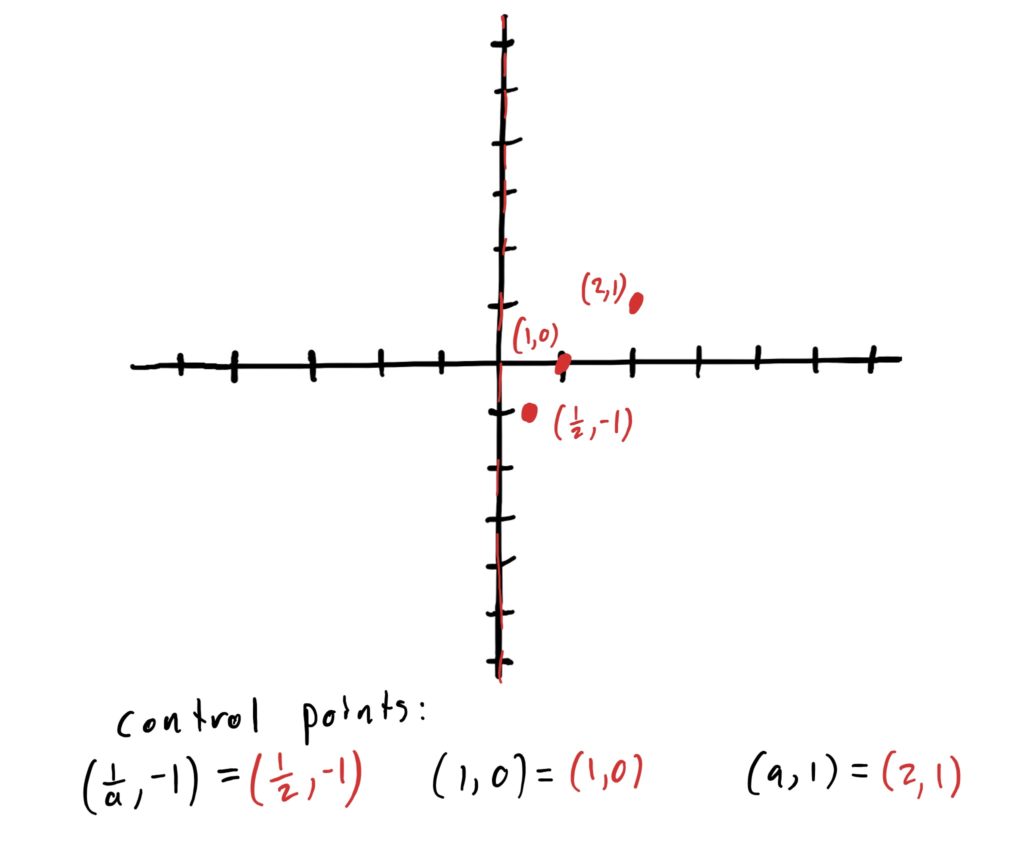
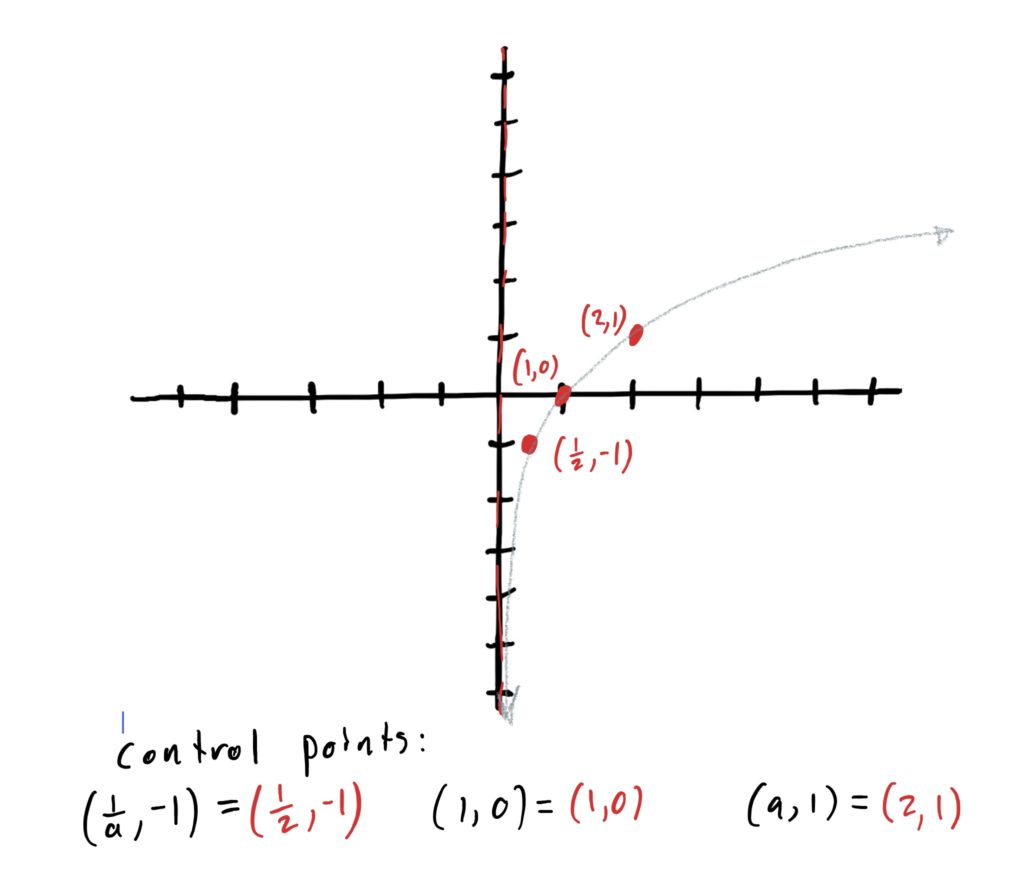
Since our simple logarithmic function is \(\log_2(x)\), our control points are
$$\left(\frac{1}{2},-1\right), (1,0), (2,1)$$
Now we plot our control points and draw the graph of our simple log function \(\log_2(x)\) through them. See below.
The order you identify transformations matters! If you shift then flip rather than flip then shift, you can get verrry different looking results. Refer to the order below and see whether or not the function was transformed in each of the following ways.
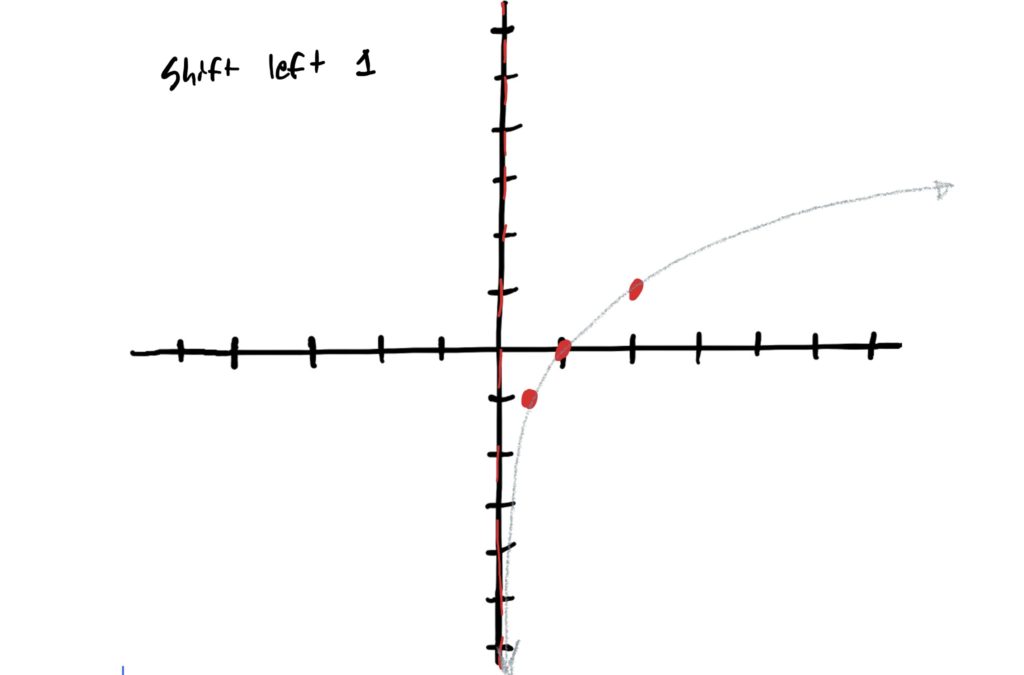
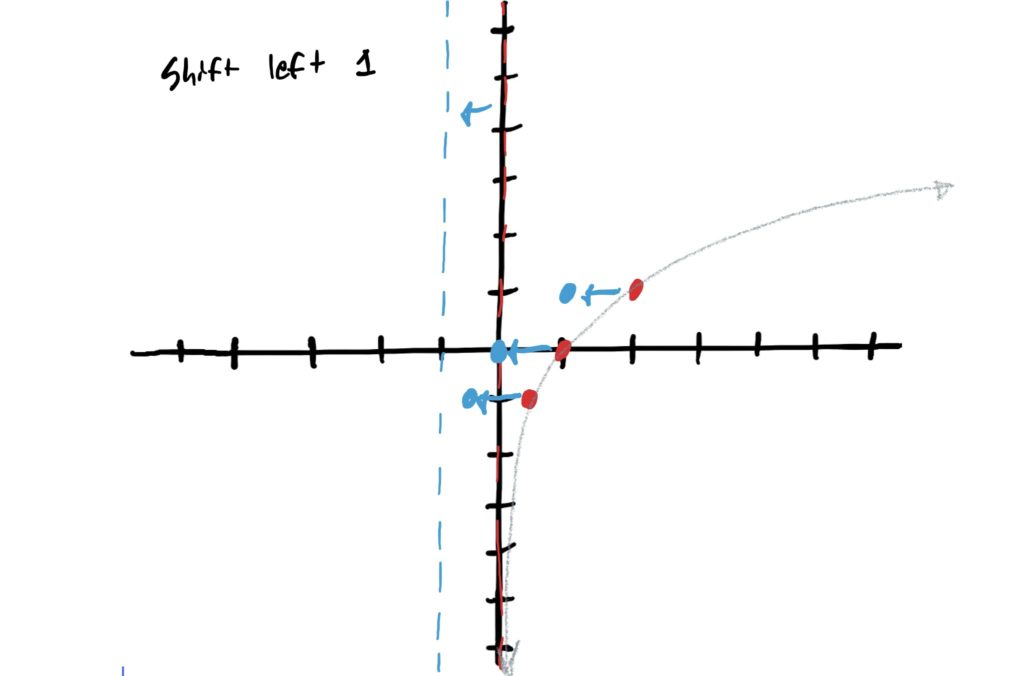
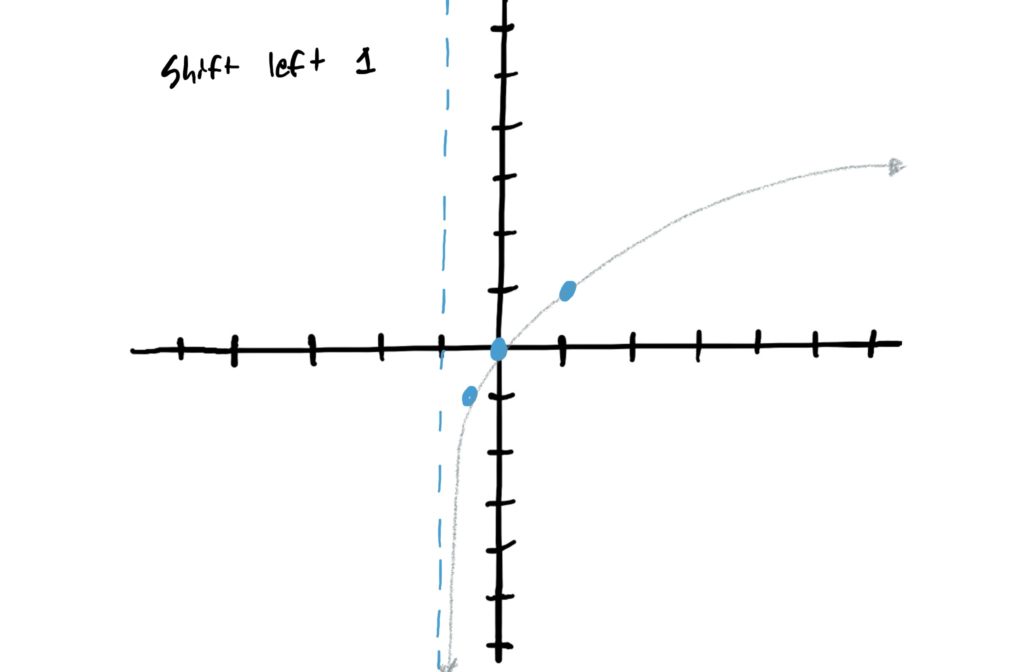
Looking at the given function \(f(x)=3\log_2(-x+1)-2\), we notice that there is a “\(+1\)” next to the \(-x\), indicating that we are shifting to the left by \(1\). (remember, for horizontal stretching or shifting, the direction of movement is counterintuitive) So we can thus shift our control points all to the left by 1 and redraw the graph. Be sure to move the asymptote to the left as well!
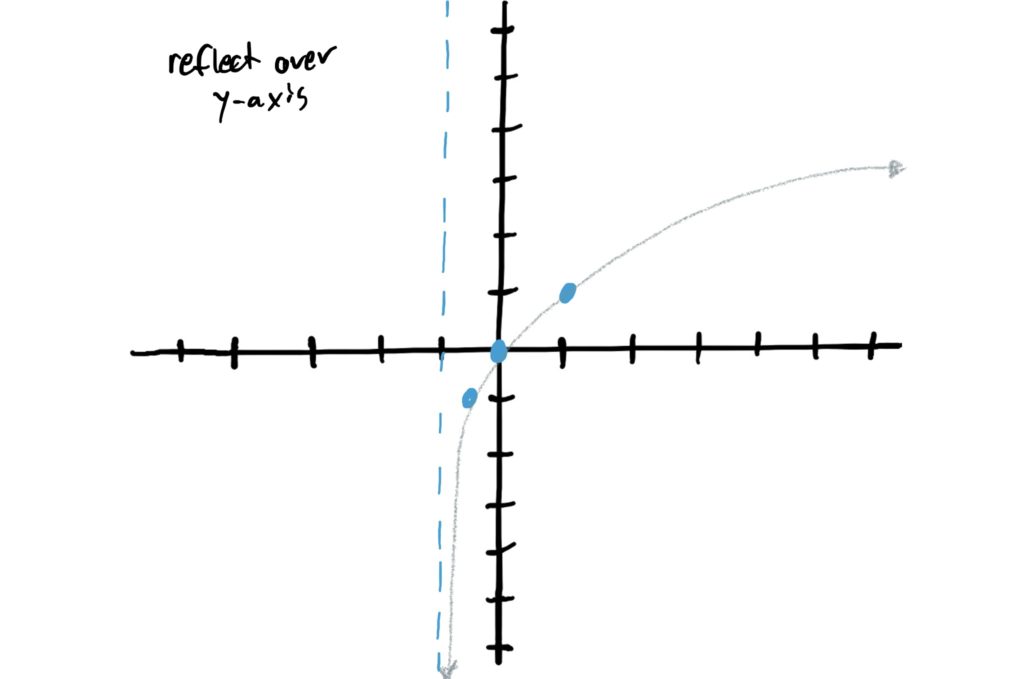
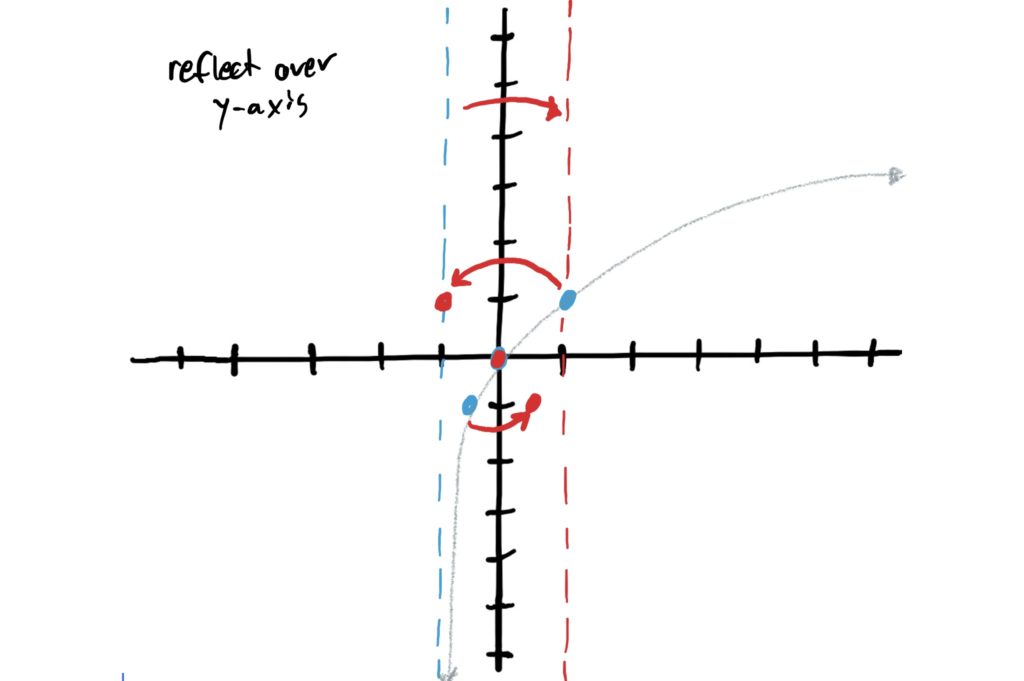
In the given function \(f(x)=3\log_2(-x+1)+4\) we notice that there is a negative (number, specifically \(-1\)) in front of the \(x\). This gives us a horizontal reflection over the \(y\)-axis. So, to graph this, flip all your control points to the other side of the \(y\)-axis. Do the same with the vertical asymptote See below. (It helps to click through the images quickly to see how this works at first)
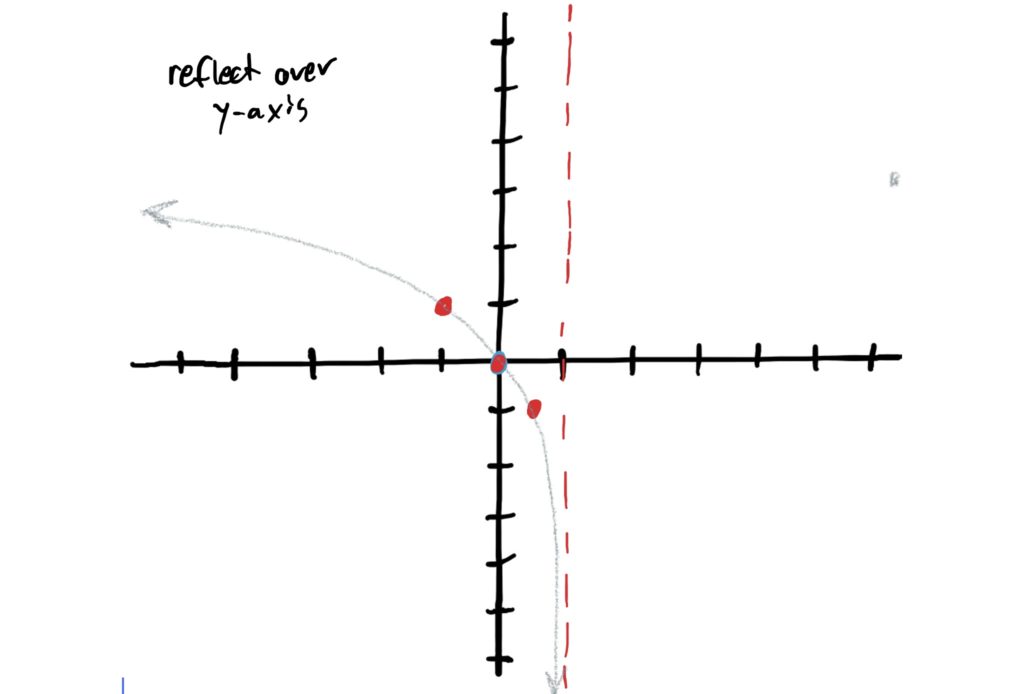
When determining whether or not a function is stretched or compressed horizontally, we are looking for a number (that is not \(1\) or \(-1\)) in front of all \(x\)’s in a given function. In our function \(f(x)=3\log_2(-x+1)+4\) there is no such number in front of \(x\) (inside the log). So there is no horizontal compression or stretching at all and our graph remains unchanged.
When determining whether or not a function is reflected vertically over the \(x\)-axis, we are looking for a negative (or a negative number) in front of the entire simple library function, in this case, the logarithm.
In our function, \(f(x)=3\log_2(-x+1)+4\), there is no negative out in front of the log, so there is no vertical reflection in this case.
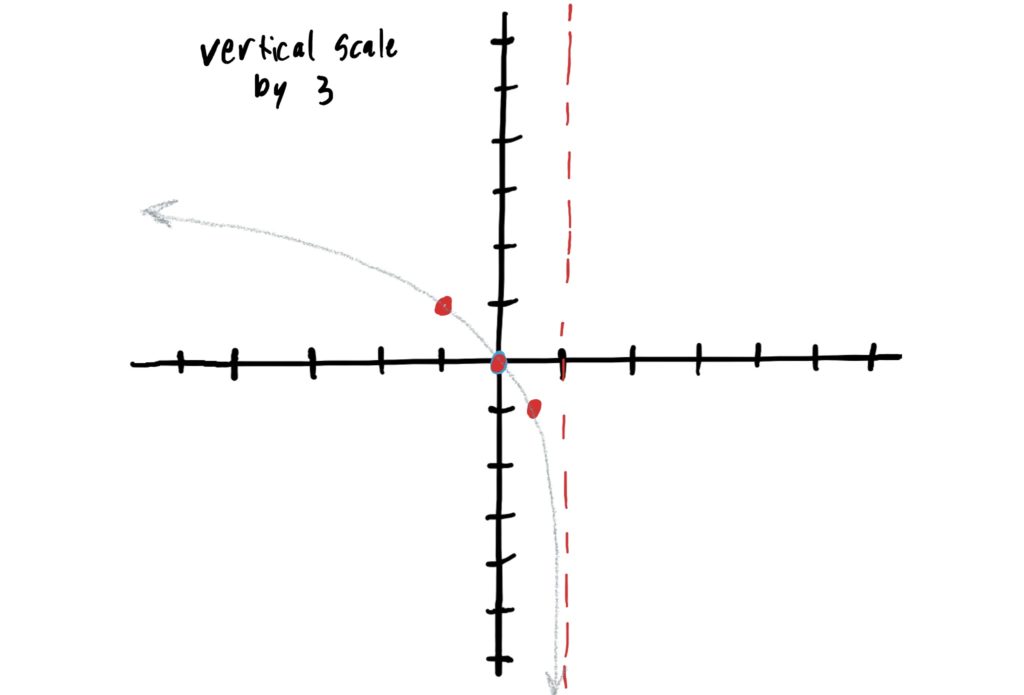
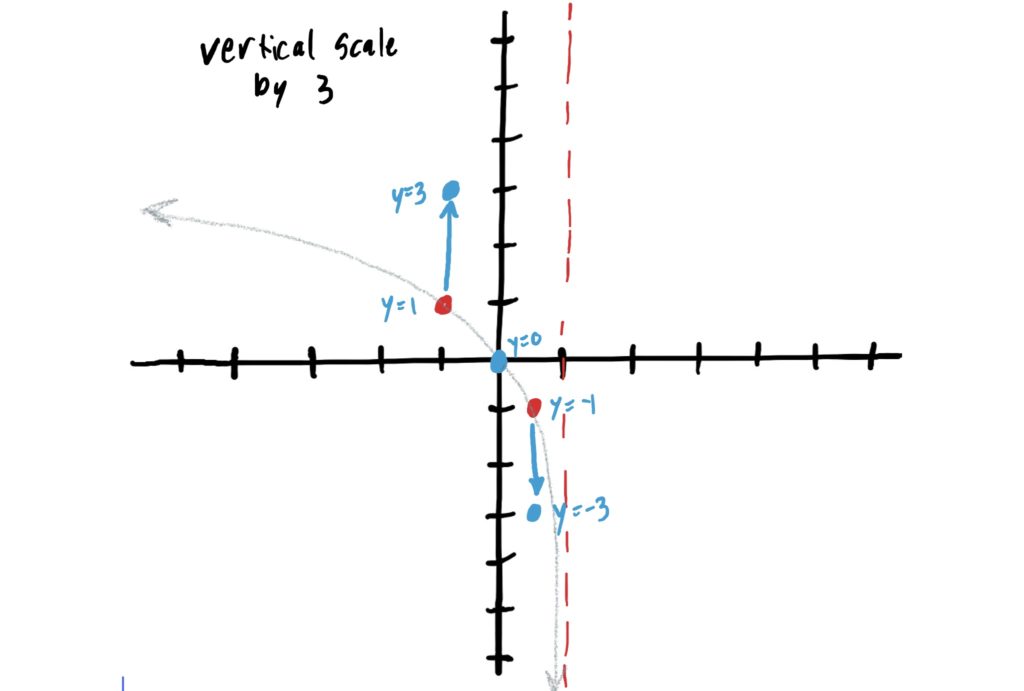
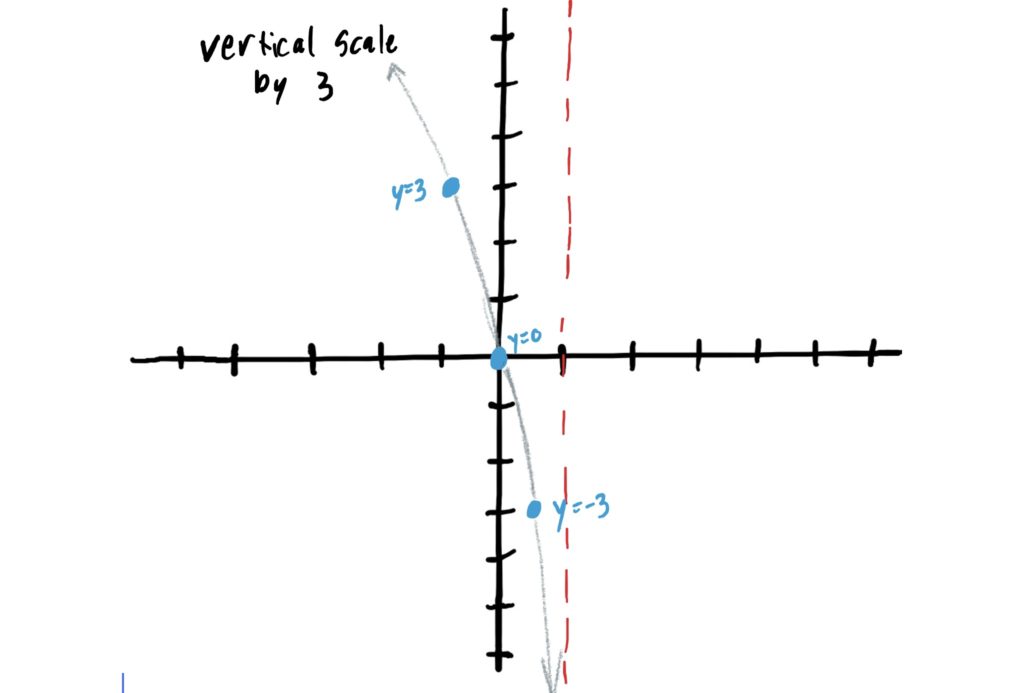
When determining whether or not a function is scaled (i.e. stretched or compressed) vertically, we are looking for a constant out in front of the log. In our function \(f(x)=3\log_2(-x+1)+4\), we have a \(3\) out in front of the log. Since \(3\) is greater than \(1\), this means we stretch vertically by a factor of \(3\). This means we multiply all \(y\) values of the control points by \(3\) and redraw the graph. This is depicted below.
When determining whether a function has a vertical shift we are looking for a constant that is being added or subtracted from the entire function. In our function \(f(x)=3\log_2(-x+1)+4\), we have a constant \(2\) being added from the whole function, indicating that our simple function is being shifted up by \(4\). To graph this, add \(4\) to the \(y\)-values of your control points, and then redraw your graph through the new control points. This is shown below.
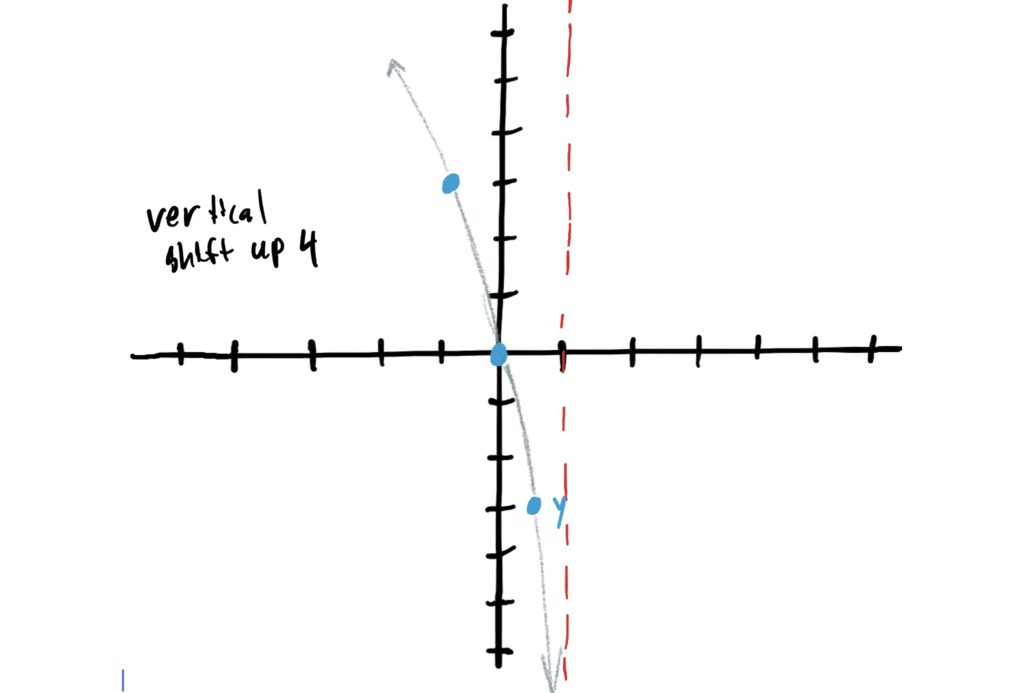
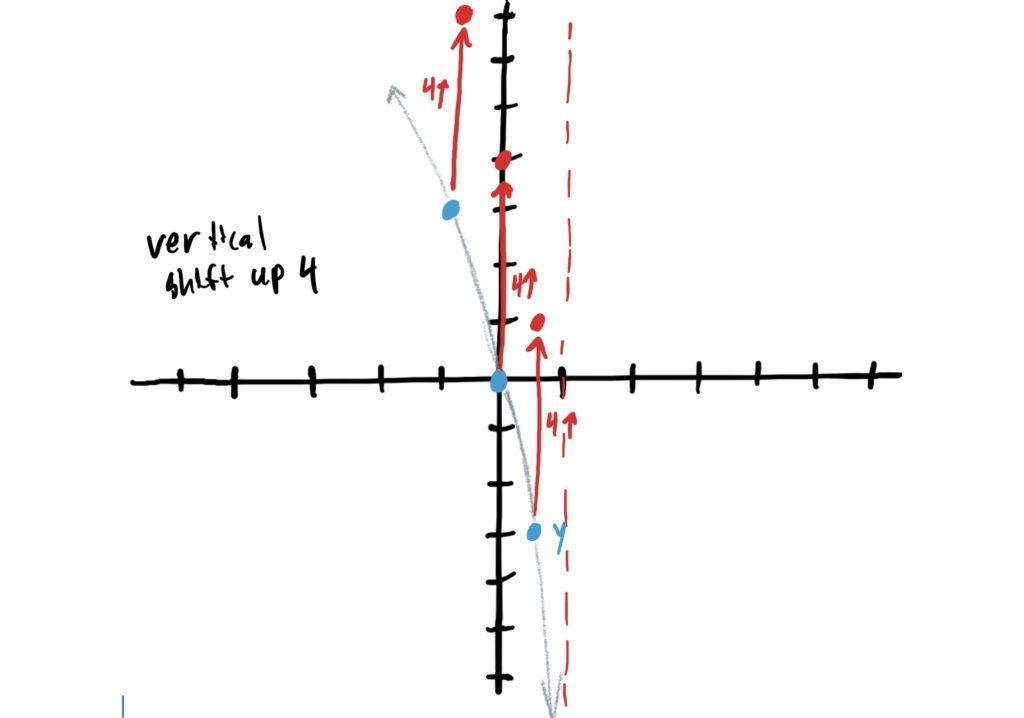
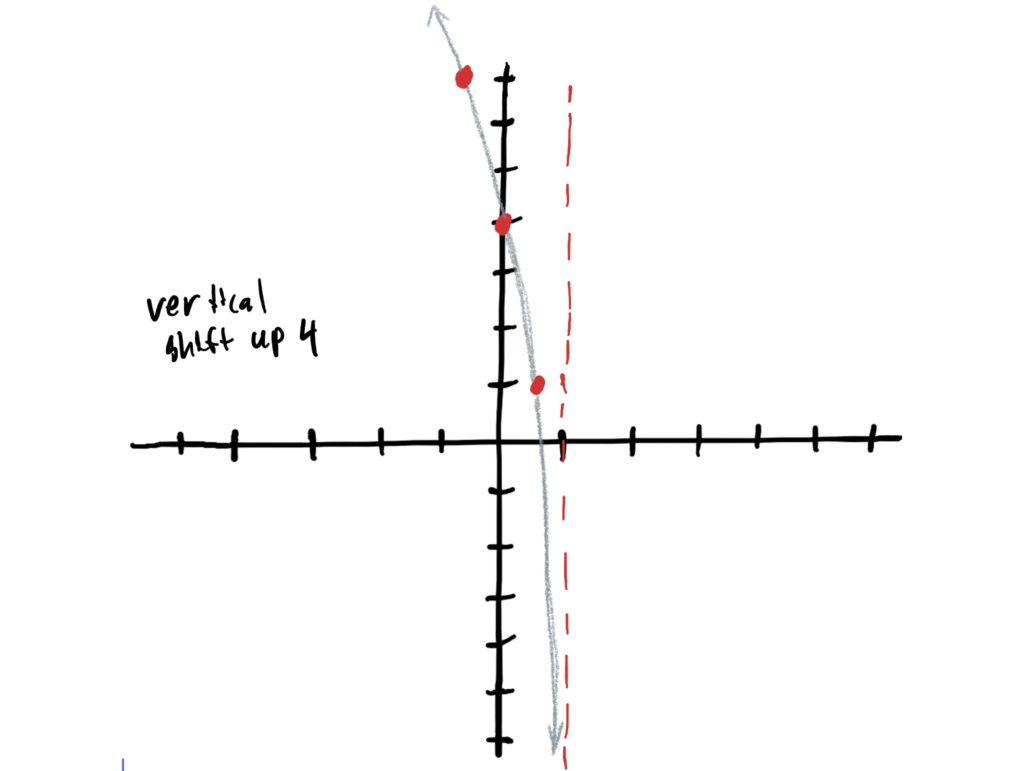
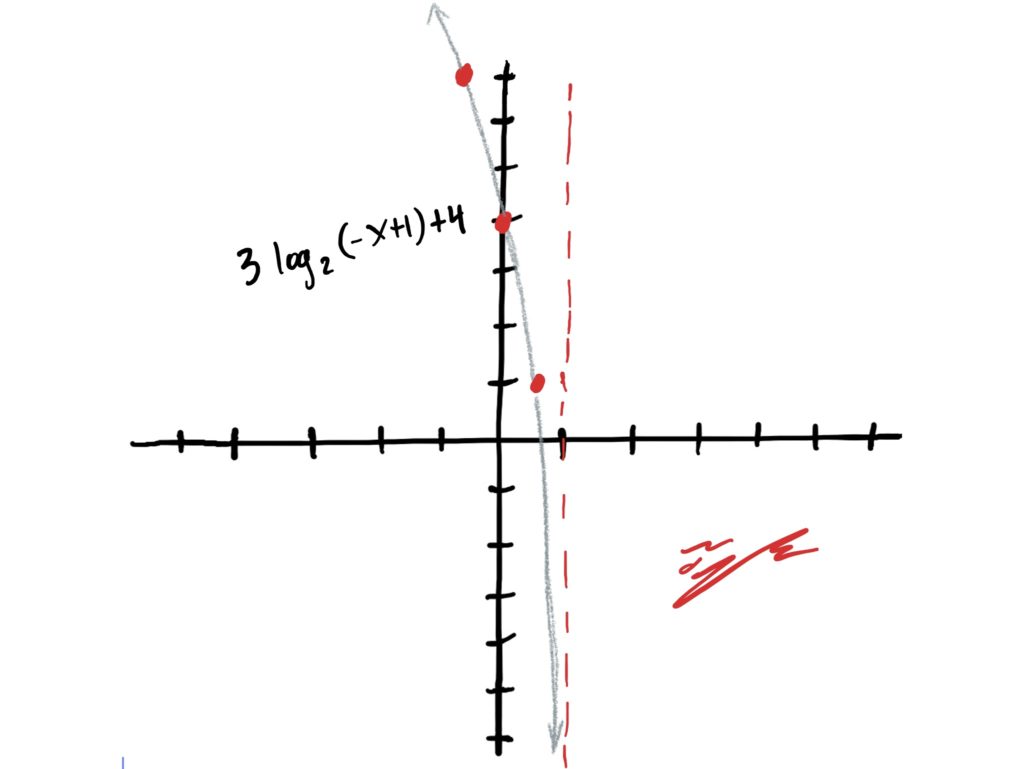
If you decided to draw a graph after each transformation in the last step, the result of Step 4 here is the last thing you drew in step 3… including your signature (sign that masterpiece of yours!) 😉
Graph the following simple logarithmic functions

First find the control points and plot those. The control points are \((\frac{1}{a},-1)=(\frac{1}{3},-1)\), \((1,0)\), \((a,1)=(3,1)\), since \(a=3\). Since the base is greater than \(1\), the \(y\)-values of the function increase as the input \(x\)-values increase. This gives the graph the shape you see below once you draw through the plotted control points. Note that the graph has a vertical asymptote at \(y=0\); i.e. it doesn’t cross the \(y\)-axis EVER!

For each of the following functions do the following:
1. Determine which simple logarithmic function of the form \(\log_a(x)\) for some number \(a\) is being used.
2. Find and plot the control points for the simple logarithmic function found in the last step. Graph the simple logarithmic function.
3. Determine the transformations applied to the simple logarithmic function IN ORDER (see above key takeaways).
4. Graph the result of all transformations from step 3 (thus graphing the function given in the problem)
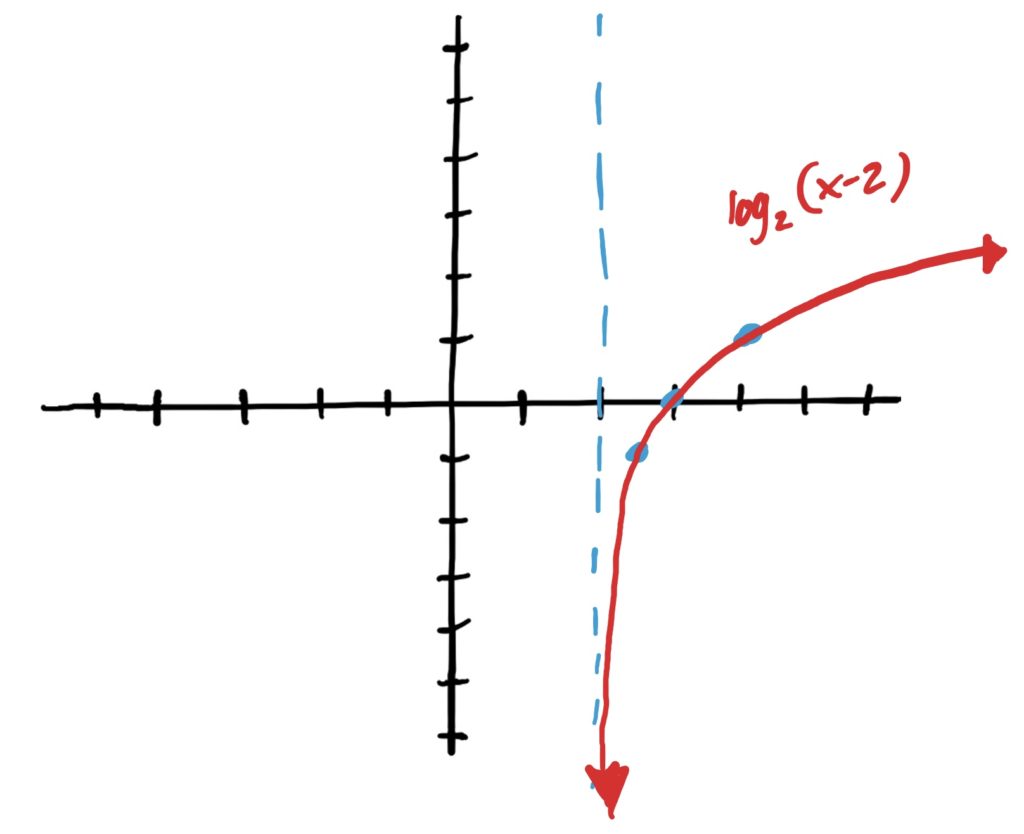
Simple Log Function: \(\log_2(x)\)
Transformations: Shift right 2
Final Graph:
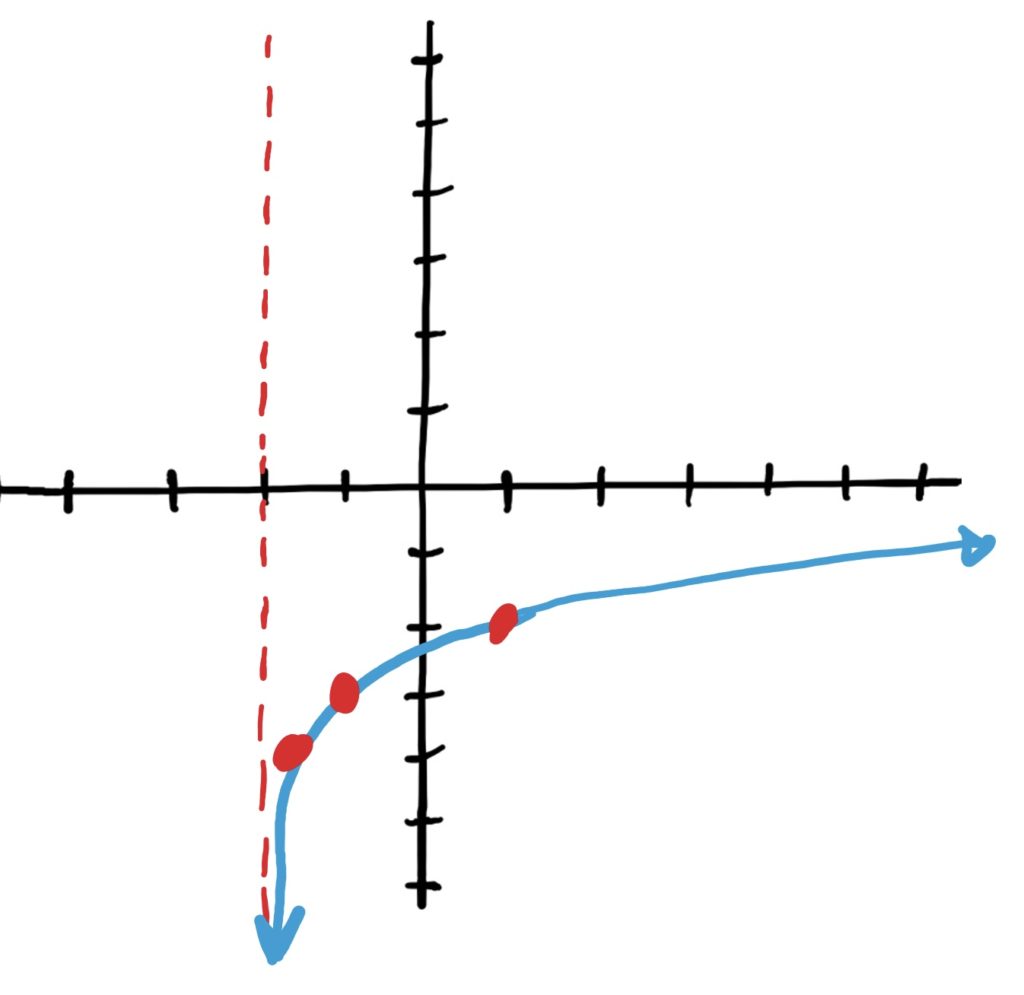
Simple Log Function: \(\log_3(x)\)
Transformations: shift left 2, then down 3
Final Graph:
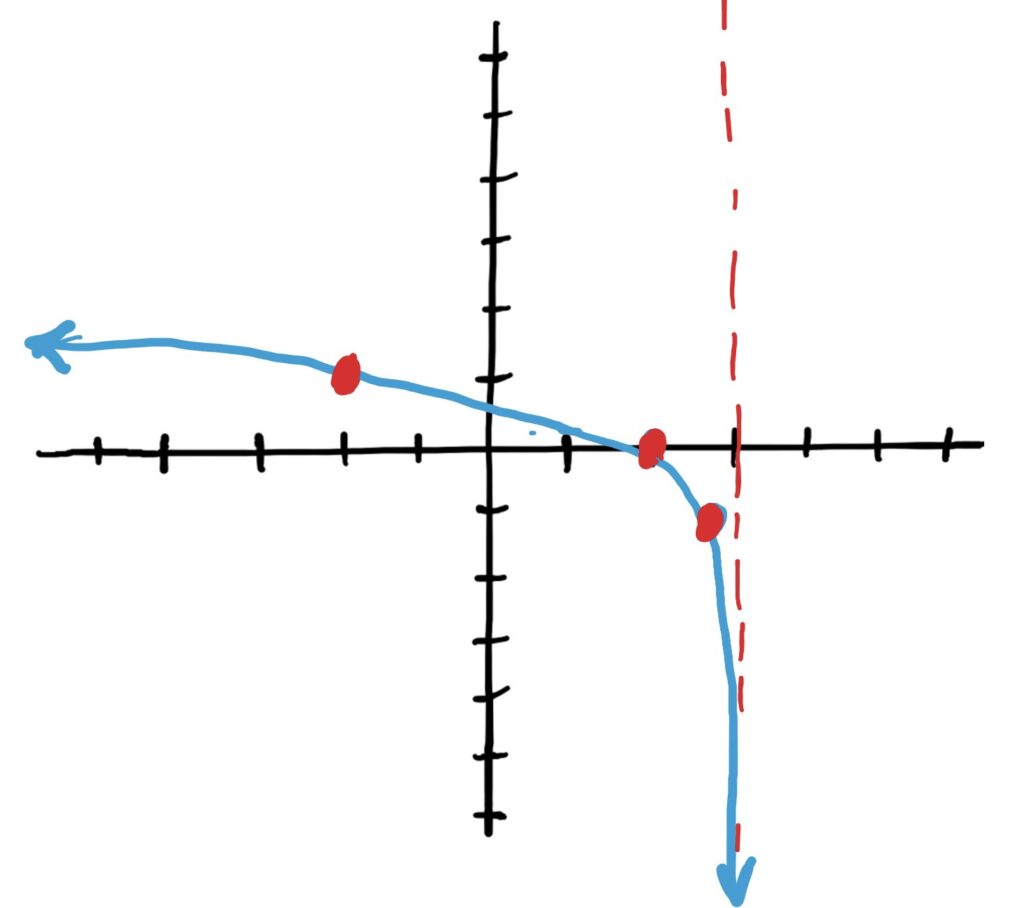
Simple Log Function: \(\log_5(x)\)
Transformations: shift left 3, then reflect horizontally over the \(y\)-axis
Final Graph:
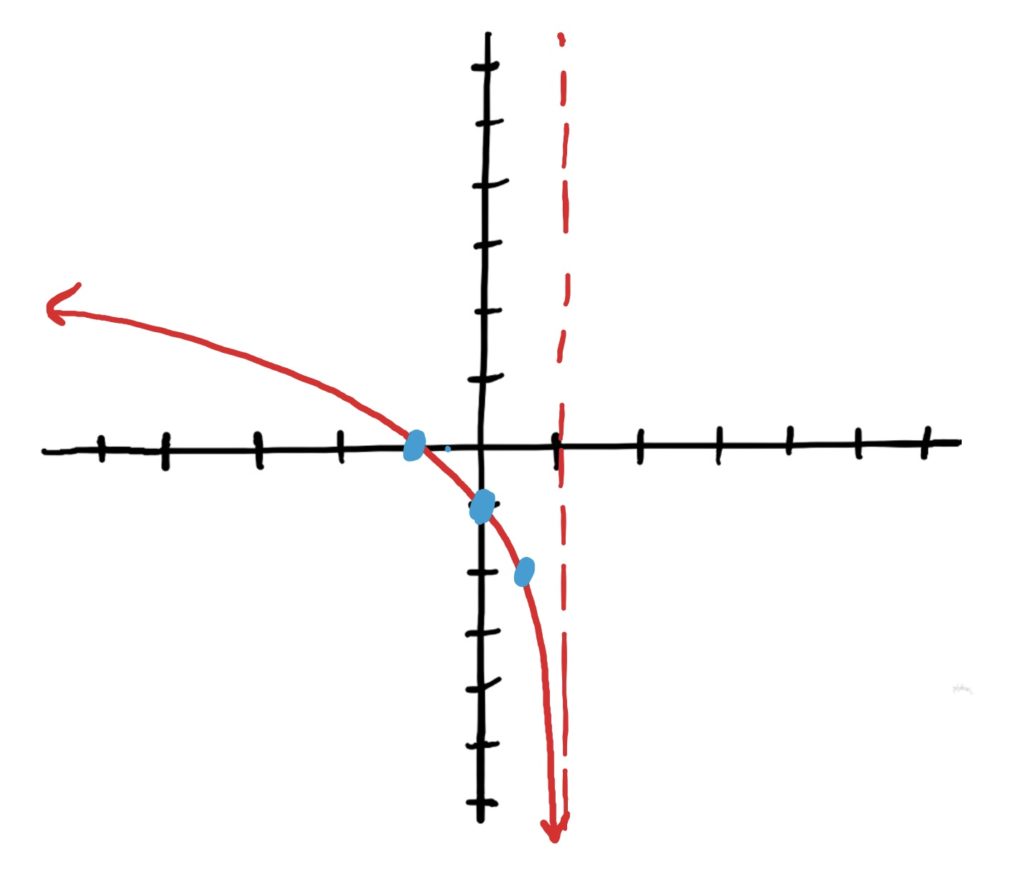
Simple Log Function: \(\log_2(x)\)
Transformations: shift left 1, reflect over \(y\)-axis horizontally, shift down 1
Final Graph:
Simple Log Function: \(\log_2(x)\)
Transformations: shift left 1, reflect horizontally over the \(y\)-axis, then scale vertically by 2.
Final Graph:
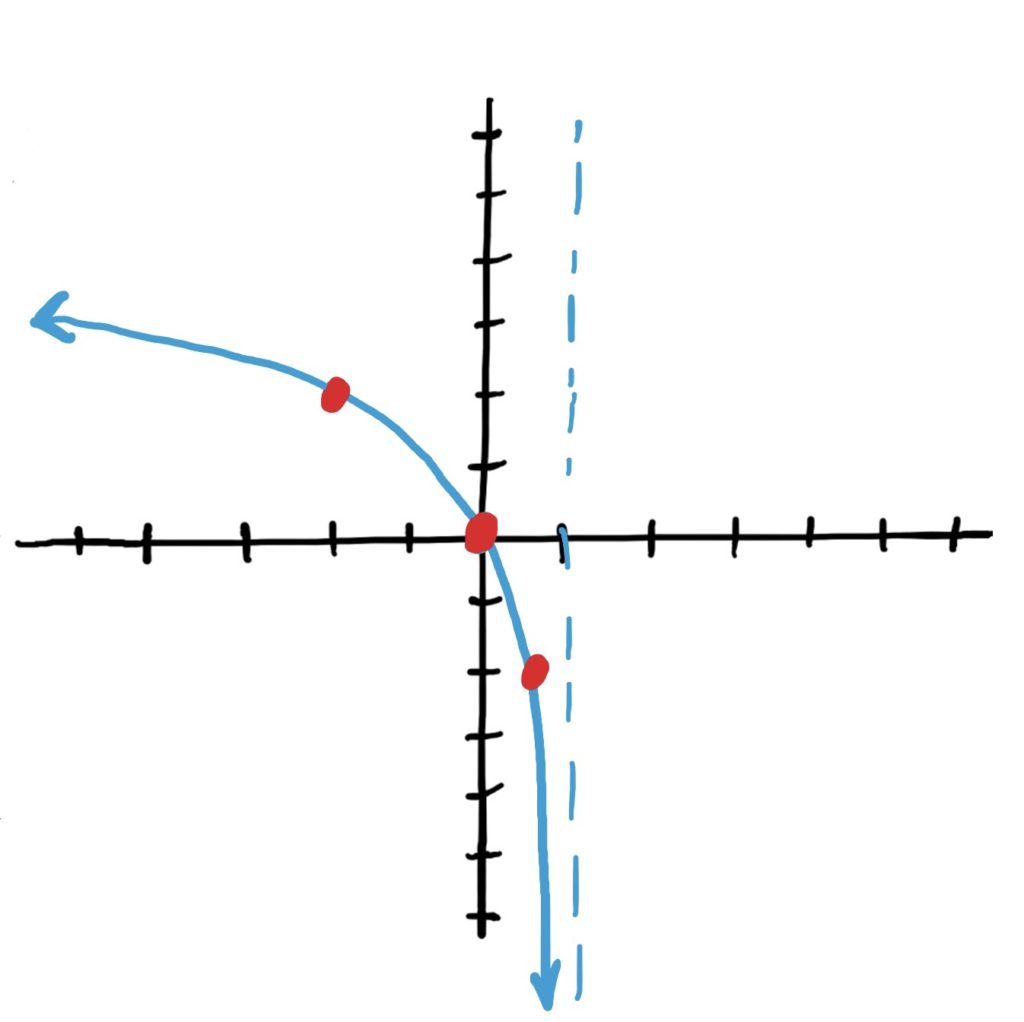
Simple Log Function: \(\log_3(x)\)
Transformations: shift left 2, scale vertically by 3, then flip vertically over the \(x\)-axis.
Final Graph:
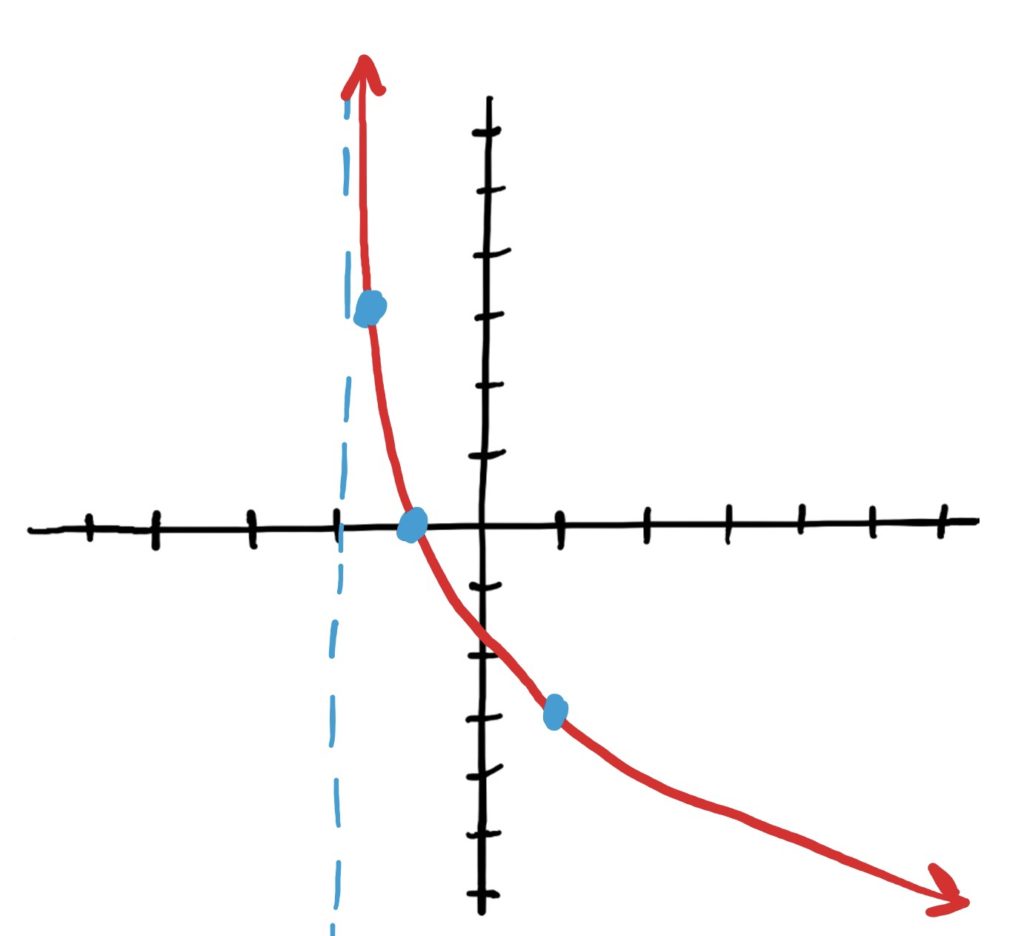
Simple Log Function: \(\log_{\frac{1}{2}}(x)\)
Transformations: horizontal reflection over the \(y\)-axis, reflected over the \(x\)-axis, and shifted up 2.
Final Graph:
