Finding Limits Using Graphs
One and Two-Sided Limits
Let \(f\) be the function given by the graph below.
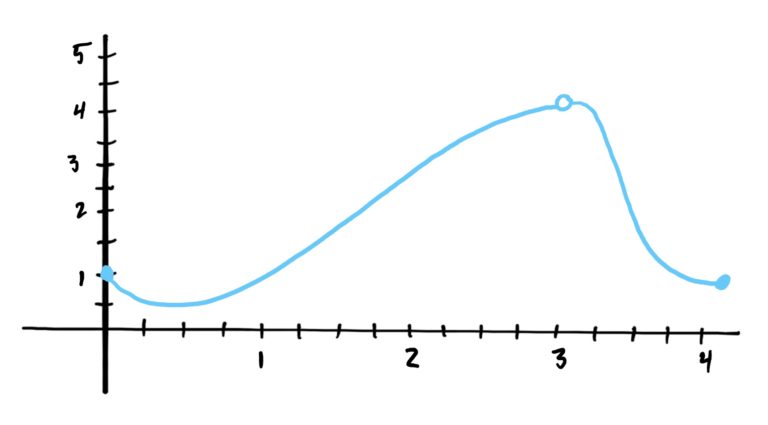
Notice that \(f\) is NOT DEFINED at \(x=3\) because there is no \(y\)-value that corresponds with \(x=3\) (the hole tells you that the graph/function is not defined wherever the open point/hole is located). However, just looking at the graph, we can tell what should be in the hole at \(x=3\).
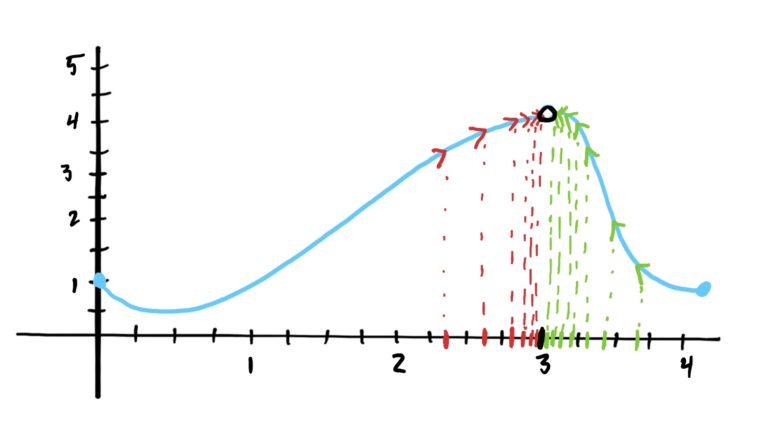
We make this determination based on what is happening to the function’s \(y\)-values at \(x\)-values that are approaching \(x=3\) on both the left and the right of \(x=3\). We notice that as the \(x\)-values get closer to \(x=3\) on the LEFT, the corresponding \(y\)-values are getting closer to \(y=4\). Similarly, as the \(x\)-values get closer to \(x=3\) on the RIGHT, those corresponding \(y\)-values increase and get closer and closer to \(y=4\) as well. See image below.
This idea is encapsulated in the following definitions.
When both one-sided limits approach the same value, we can determine a two-sided limit.
In the example above (graph given again below for convenience), we have \(\lim_{x\rightarrow 3}f(x)=4\) because we have both \(\lim_{x\rightarrow 3^+}f(x)=4\) and \(\lim_{x\rightarrow 3^-}f(x)=4\); hence the (two-sided) limit of \(f\) at \(x=3\) is \(y=4\).
Note: we don’t usually say “two-sided limit” unless it makes sense from context to do so. Normally, we simply refer to the two-sided limit of a function as just “it’s limit,” without indication of “sides.”
When a Two-Sided Limit Doesn’t Exist
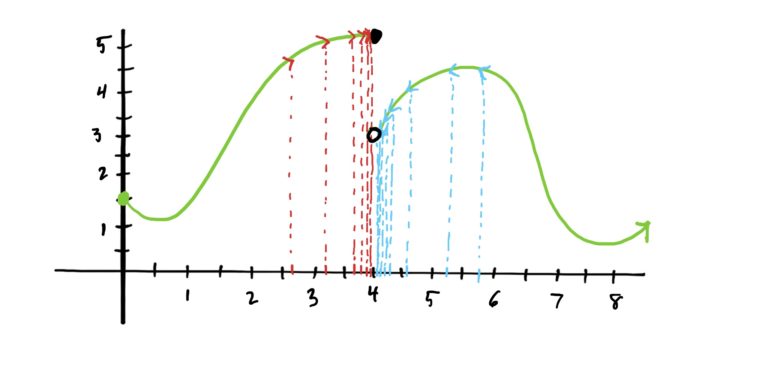
Let \(g\) be the function given by the graph below.
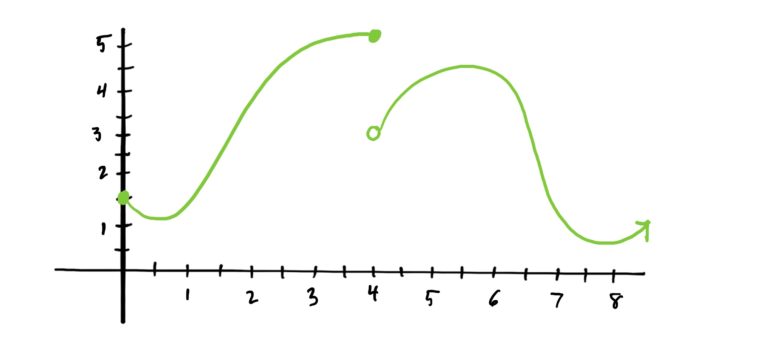
Notice that there is a “jump” in the graph at \(x=4\). Furthermore, notice that \(\lim_{x\rightarrow 4^+} g(x)=3\) whereas \(\lim_{x\rightarrow 4^-} g(x)=5\). Said verbally, the right-hand limit of \(g\) at \(x=4\) is 3, but the left-hand limit of \(g\) at \(x=4\) is 5. Since the left-hand limit and the right-hand limit are different, the two-sided limit DOES NOT EXIST! See this illustrated below.
When a Limit Is Different From the Function’s Value at a Point
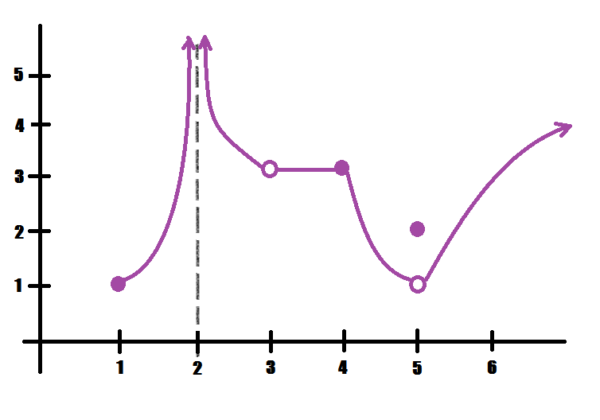
Occasionally, we run into the circumstance that we see in the graph below, where there is not only a hole but a point above or below the hole.
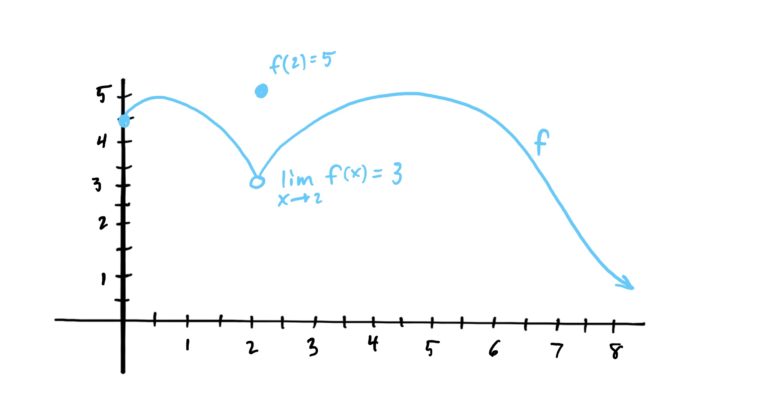
In this case, the function is defined at \(x=2\) and \(f(2)=5\), but notice that as we approach \(x=2\) from both the left and the right, we end up with a two-sided limit of \(y=3\). This illustrates that sometimes the function’s output on a specific \(x\)-value input might differ from what’s happening to the function’s outputs close by.
To express this idea mathematically, we’d write
$$\lim_{x\rightarrow 2}f(x)=3 \neq f(2)$$
- \(\lim_{x\rightarrow 1^+} f(x)\)
- \(\lim_{x\rightarrow 1^-} f(x)\)
- \(\lim_{x\rightarrow 1} f(x)\)
- \( \lim_{x\rightarrow 2}f(x)\)
- \(\lim_{x\rightarrow 3} f(x)\)
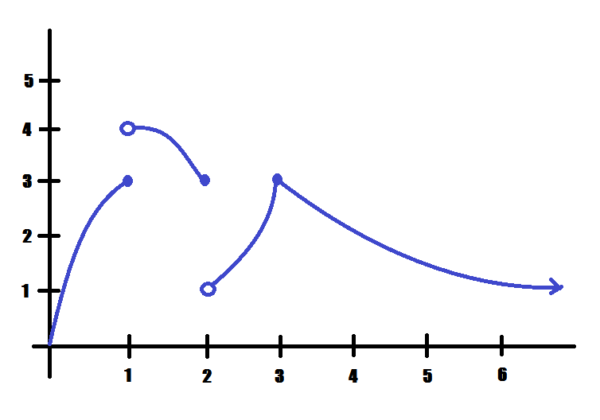
- \(\lim_{x\rightarrow 1} f(x)\)
- \(\lim_{x\rightarrow 3} f(x)\)
- \(\lim_{x\rightarrow 4} f(x)\)
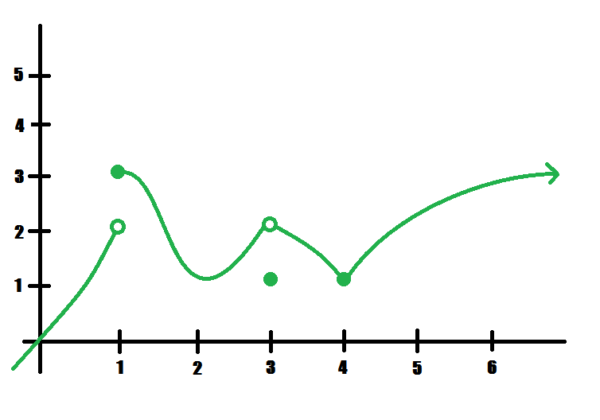
- \(\lim_{x\rightarrow 1^+} f(x)\)
- \(\lim_{x\rightarrow 2} f(x)\)
- \(\lim_{x\rightarrow 3} f(x)\)
- \(\lim_{x\rightarrow 5}f(x)\)