Concavity and Inflection Points With Graphs
Rates of Change of Rates of Change
Take a look at the graph below representing the total number of subscribers on a media streaming service over time. The graph is modeled or “summarized” by the smooth function \(g\) passing through the graph’s data.
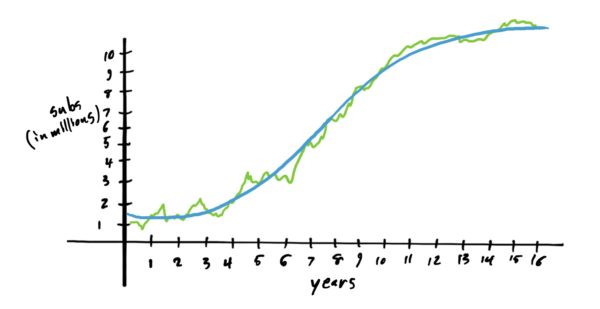
If one were to find the derivative/slope of \(g\) at any point on the blue/smooth curve, this would represent the instantaneous rate of change of \(g\) at that point. In the context of the situation, this would represent how many new subscribers (according to the model) the service is adding at that point in time. See graph below with tangent line at \(x=5\) years, with slope of about \(1/2\) (indicating a rate of \(1/2\) million new subs per year).
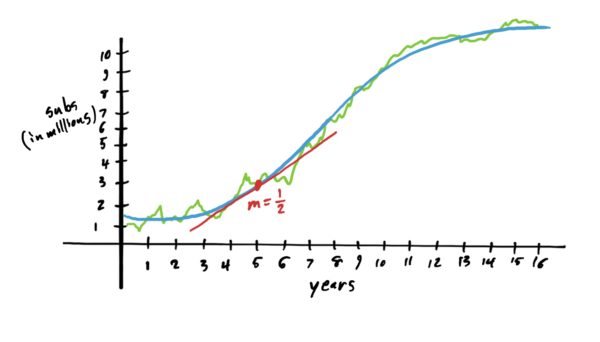
One thing that is of high interest to investors and the company itself is not only how many new subscribers are being added, but also the rate of new subscriber acquisition. That is, we might want to know the “rate of change of the rate of change.” Recall that the first derivative at a specific \(x\)-value tells you the rate of change of the function at that point. The second derivative, therefore, tells you the rate of change of the derivative, or rather how quickly the slope of the graph is increasing or decreasing. More on this later.
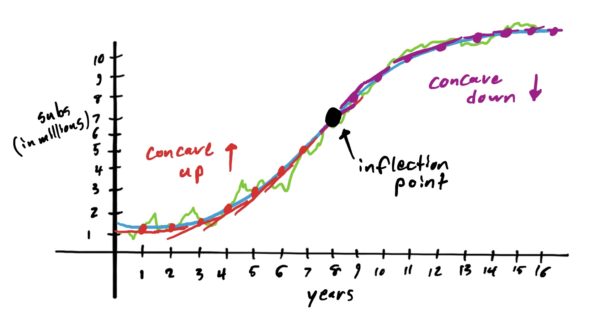
Now, if we draw several tangent lines up until about \(x=8\) we notice that the slopes are increasing, indicating that the company is adding increasingly many new subscribers over time (much to the satisfaction of shareholders).
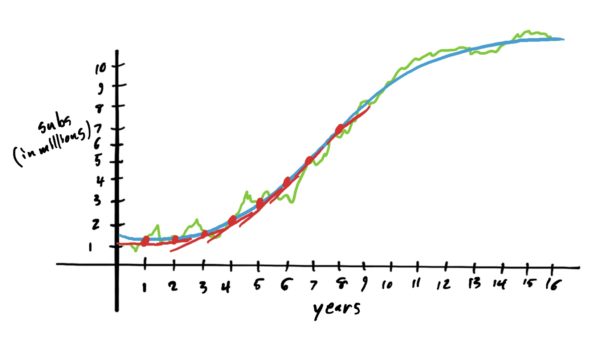
Because the blue modeling graph \(g\) is increasingly increasing from \(x=0\) to \(x=8\), the graph takes somewhat of a “cup” shape. In which case, we would say that \(g\) is concave up on that interval.
Now, if you draw tangent lines from \(x=8\) up until \(x=16\), the slopes of said tangent lines are decreasing, indicating that the rate of new subscriber acquisition is slowing (much to the frustration of company shareholders). Notice that this slowing of growth is indicated by a graph shape that is more reminiscent of a hilltop. When a graph has this sort of shape on an interval, we would say that the graph is concave down on that interval.
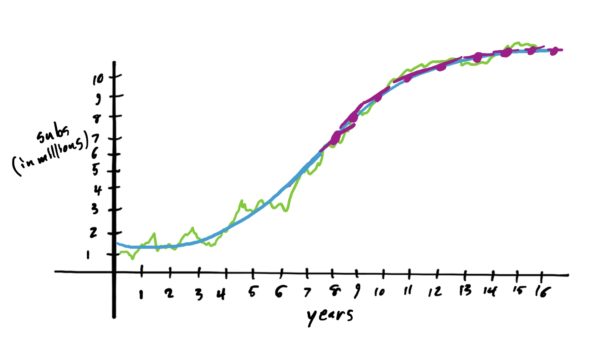
The \(x\)-value where the graph changes direction of concavity is referred to as an inflection point. The inflection point on our graph is \(x=8\). See below
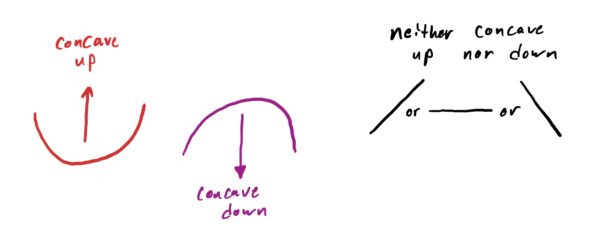
The examples below have you determine the intervals where graphs are concave up, down, or neither, and also identify any inflection points on the graph. The following diagram is helpful for this:
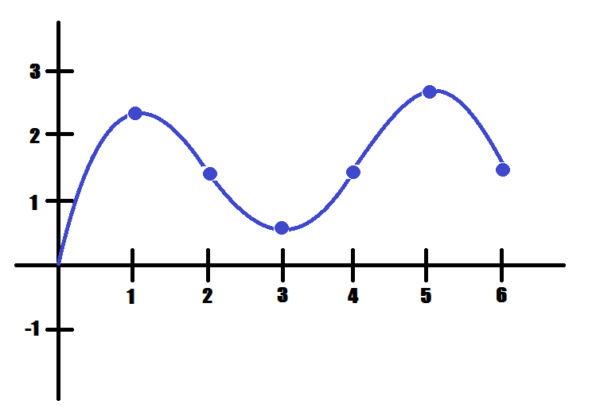
Look for where the graph changes from curving upward to downward, or vice versa.
- Concave down on: \([0,2),\ (4,6]\)
- Concave up on: \((2,4)\)
- Inflection points: \(x=2,4\)

Look for where the graph changes from curving upward to downward, or vice versa.
- Concave down on: \([0,1),\ (1,3)\)
- Concave up on: \((3,\infty)\)
- Inflection points: \(x=3\)

Look for where the graph changes from curving upward to downward, or vice versa.
- Concave down on: \([0,2),\ (4,6]\)
- Concave up on: \((2,4)\)
- Inflection points: \(x=2,4\)

Look for where the graph changes from curving upward to downward, or vice versa.
- Concave down on: \([0,2),\ (2,4),\ (4,6]\)
- Inflection points: none

Look for where the graph changes from curving upward to downward, or vice versa.
- Concave down on: \((2,4)\)
- Concave up on: \((0,2)\)
- Neither concave up or down: \((4,6]\)
- Inflection points: \(x=2\)
