Solving Equations Using Graphs
Solving equations using graphs
Recall that when we are given an equation to solve, such as \(3x+1=6\), we are looking for an input \(x\)-value that we can plug into \(3x+1\) and get out a \(y\)-value of \(6\). As we know, functions can also be represented as \(xy\)-graphs, and so, we can use the same idea of inputs and outputs to solve equations using graphs of functions.
Essentially, we are being asked to solve the equation \(x^2+1=5\). So, using the method given above, we first graph \(f(x)=x^2+1\) and also the constant function \(g(x)=5\) (i.e. the right-hand-side of the equation, even though it wasn’t explicitly given to us as a function). Note that the function \(g(x)=5\) is drawn as a flat line at \(y=5\).

The blue graph above is the graph of \(f(x)=x^2+1\) and the green graph is the constant function \(g(x)=5\). To solve the equation \(x^2+1=5\), we want to know the \(x\)-value that makes the outputs (i.e. the \(y\)-values) of these two functions the same. So, looking at the graph, we notice that the graphs intersect at the red points. This is where the \(y\)-values of the two functions are the same. The \(x\)-values that correspond to these points are \(x=-2\) and \(x=2\), which are thus the solutions to the equations.
Notice that if you plugged these \(x\)-values into the two functions you will get the same \(y\)-value output. That’s exactly what is supposed to happen. That’s how you know these \(x\)-values are solutions to the equation!
Notice that in this problem we are not explicitly given two functions. However, there is nothing wrong with defining our own functions to solve a problem! Let \(f(x)=x^2+3x-4\) and \(g(x)=-x^2+2\), i.e. the left-hand side and the right-hand side, respectively. Graph both either by hand or using a graphing utility.

The blue function is \(f\). \(g\) is the green one. Notice that they intersect at the red points drawn. The \(x\)-values of these points are (roughly) \(x=-2.75\) and \(x=1.25\). Recall that graphs can only give you approximations.
These two \(x\)-values will solve the equation. They are precisely when the two functions have the same output, i.e. when their outputs are the same. Put another way, it’s when the functions are equal.
When equations can’t be solved
As mentioned in prior lessons, there are cases where equations can’t be solved; i.e. there are no \(x\)-values that make both sides of an equation equal. Using other methods, it is usually a bit involved to determine whether or not an equation has any solutions. Graphs make this easy.
Essentially, we are being asked to solve the equation \(x^2+2=-1\). So, using the method given above, we first graph \(f(x)=x^2+2\) and also the constant function \(g(x)=-1\) (i.e. the right-hand-side of the equation, even though it wasn’t explicitly given to us as a function). Note that the function \(g(x)=-1\) is drawn as a flat line at \(y=-1\).

The blue graph above is the graph of \(f(x)=x^2+2\) and the green graph is the constant function \(g(x)=-1\). To solve the equation \(x^2+2=-1\), we want to know the \(x\)-value that makes the outputs (i.e. the \(y\)-values) of these two functions the same. So, looking at the graph, we notice that the graphs DO NOT INTERSECT. Therefore, there are no \(x\)-values for which the function \(f(x)=x^2+2\) produces an output \(-1\).

The functions have the same \(y\)-value outputs when \(x=-3, 1, \) or \(4\) (approximately).
Look for where the functions’ graphs cross. The \(x\)-values of those points are the inputs for which \(f(x)=g(x)\); i.e. where the outputs of the functions are the same.
Your answers may be slightly different from these.
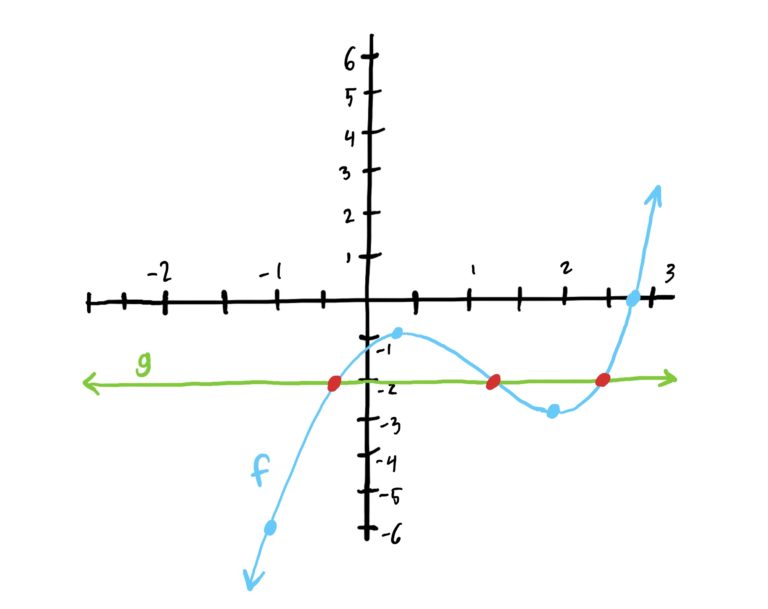
\(x=-0.5, 1.25, 2.5\)
Start by graphing the function \(f(x)=x^3-3x^2+x-1\) and the constant function \(g(x)=-2\). See below.

Notice that the two graphs intersect when \(x=-0.5, 1.25, 2.5\). This is precisely where the outputs of the two functions are equal, and therefore are the solutions to the equations given.
There are no solutions for this equation. That is, there are no \(x\)-values where \(x^2=x-1\)… at least no real \(x\)-values.
First, graph the two functions on each side of the equation and see where they cross, if at all. Remember that if the graphs of the functions do not cross, then there are no solutions to the equation.

