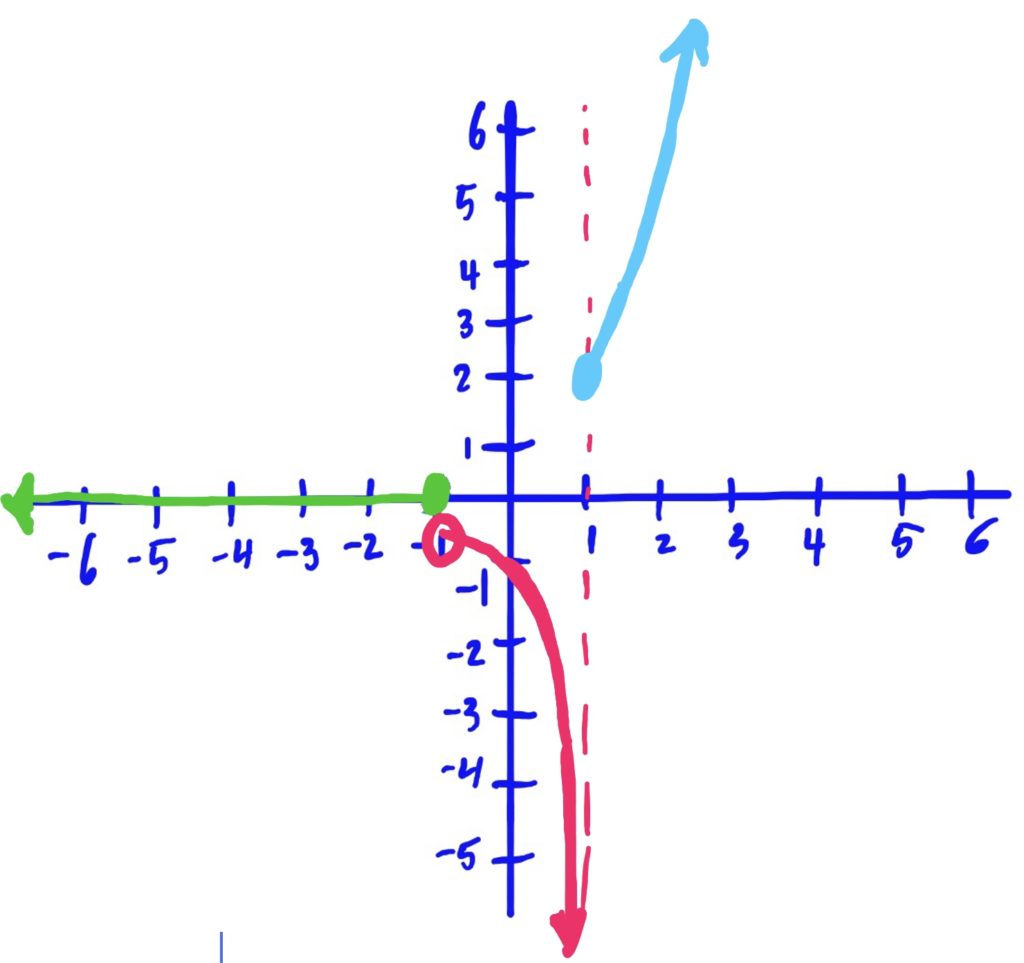
Graphing Piecewise-Defined Functions
Brief Review of How Piecewise Functions Work
Recall that a piecewise defined function (or just “piecewise function,” colloquially) is a function that is built from different function rules, where the rule that is used to evaluate the function’s value depends on the input value. To find the value of the whole function at some specific \(x\)-value, first determine which rule you need to use based on your input, and then plug that input into that rule.
For example, let
$$
f(x)=\begin{cases}
x^2 & x\leq 0 \\
2x+1 & 0<x\leq 5 \\
x^3 & 5> x
\end{cases}
$$
If you wanted to find the output of the function above on input \(x=2\), we notice that of the three conditions listed on the right-hand-side of the function’s definition, the second condition of \(0<x\leq 10\) is the one that applies if \(x=2\). So, to produce a \(y\)-value for the whole entire function \(f\) at \(x=2\), we plug \(x=2\) into the second function and see what output is produced (in this case, the answer is \(5\)).
How to Graph Piecewise Functions
To graph piecewise functions, use the following steps
$$
f(x)=\begin{cases}
x^2 & x\leq -1 \\
2x+1 & -1<x\leq 1\\
\frac{1}{x} & 1< x
\end{cases}
$$
We use the same method as described above: Graph, Shade, Erase
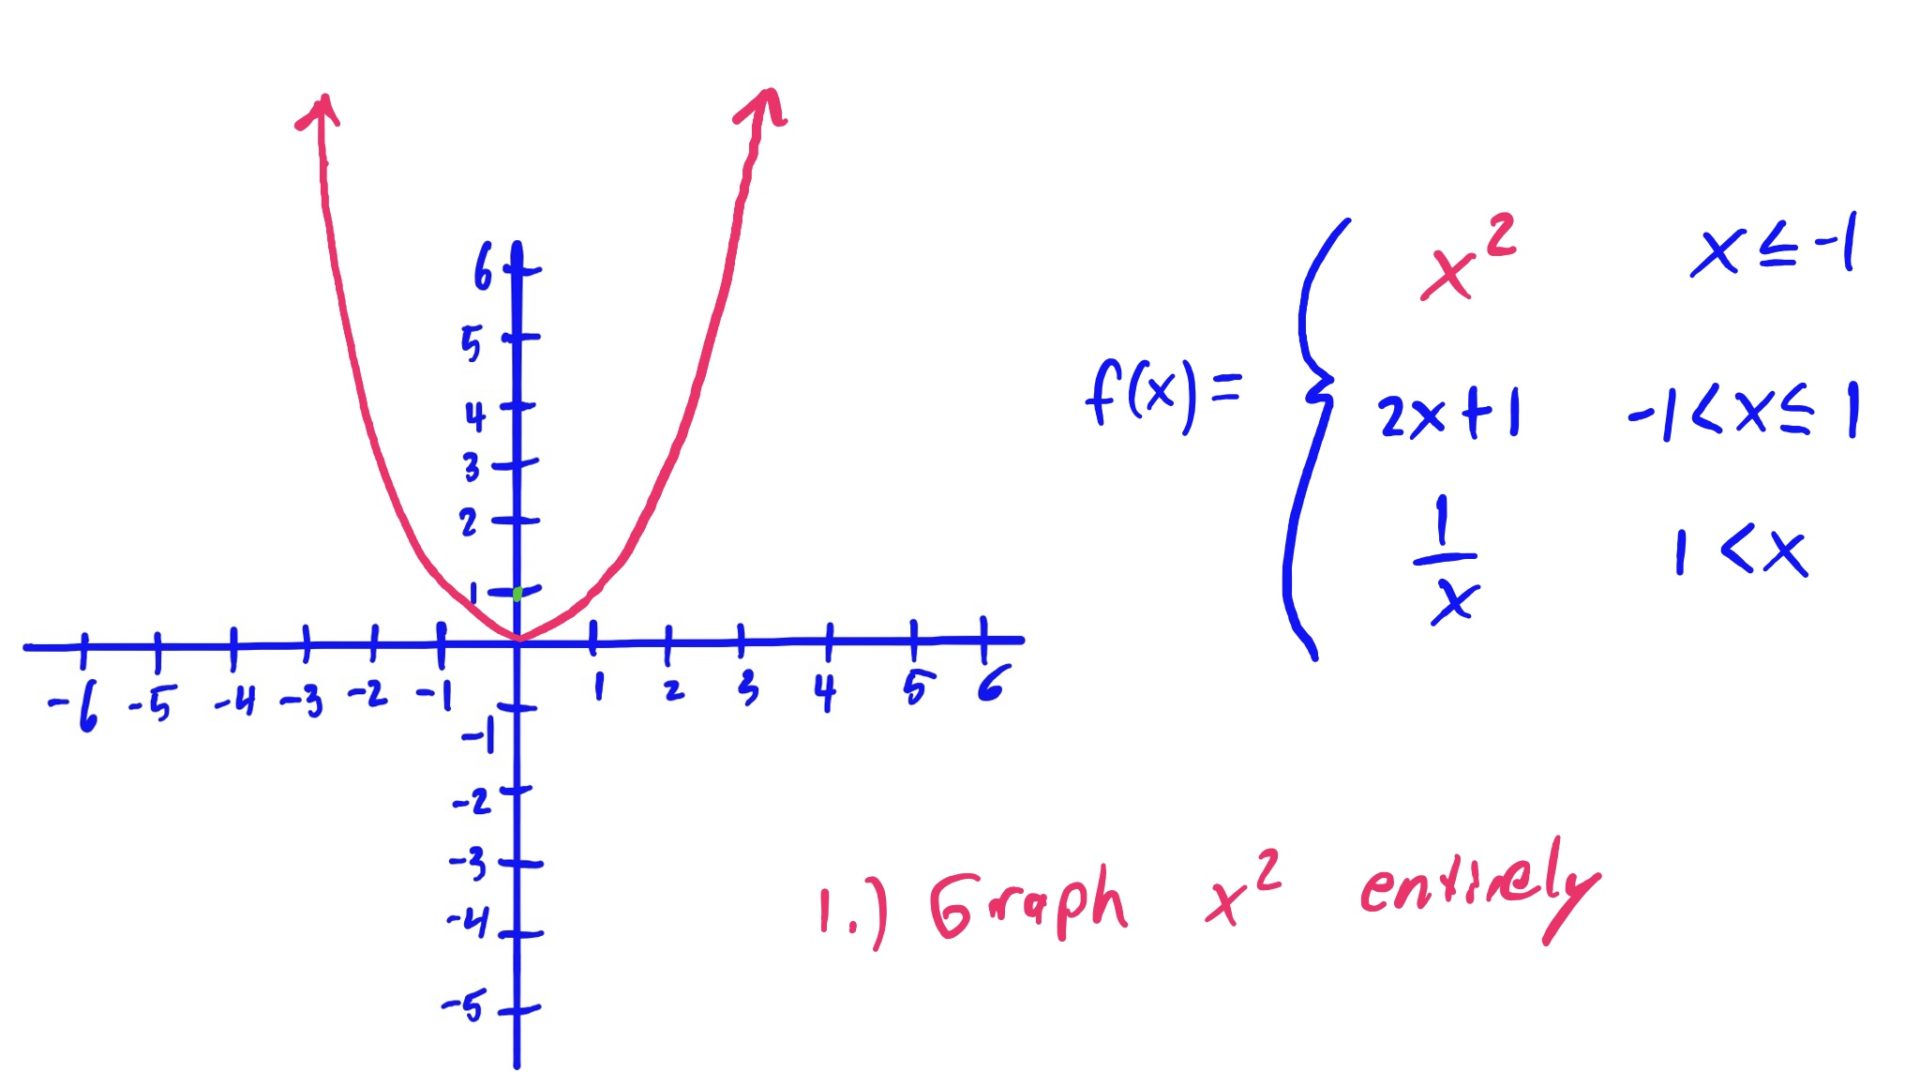
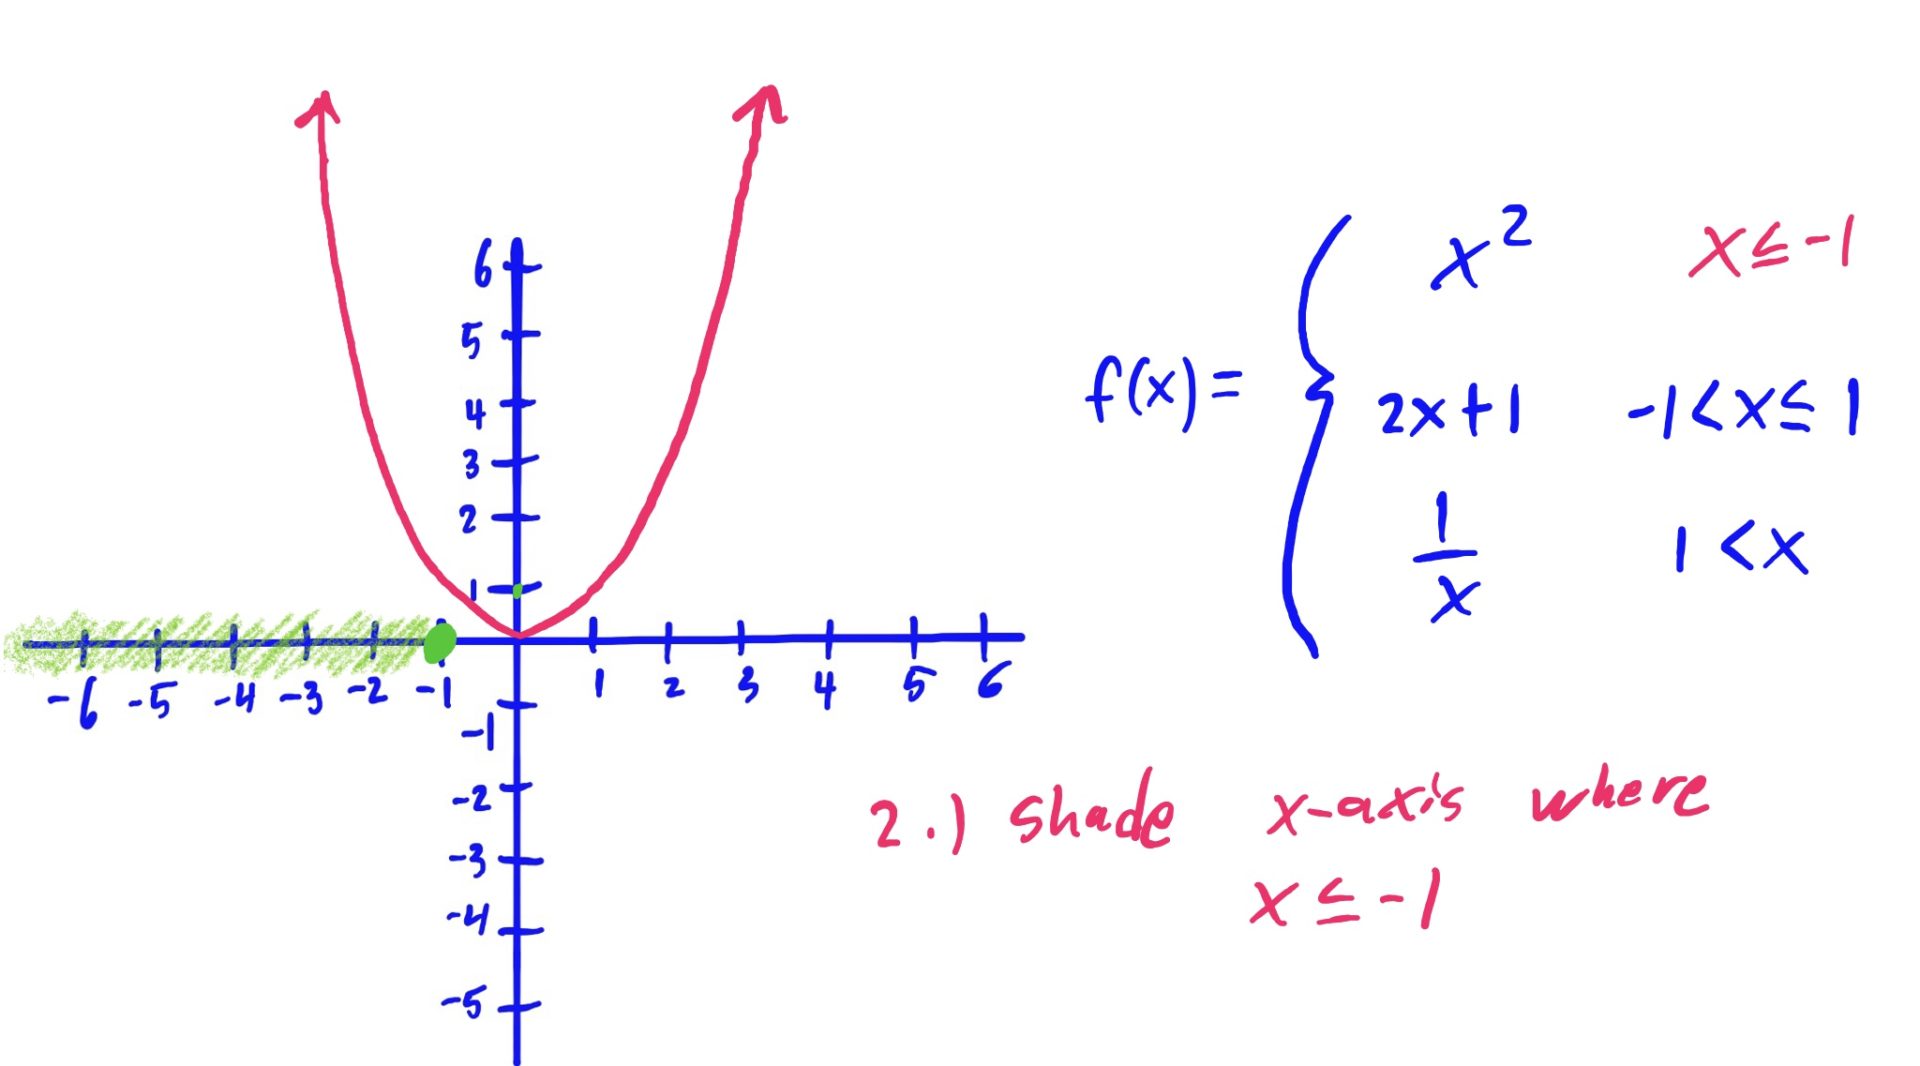
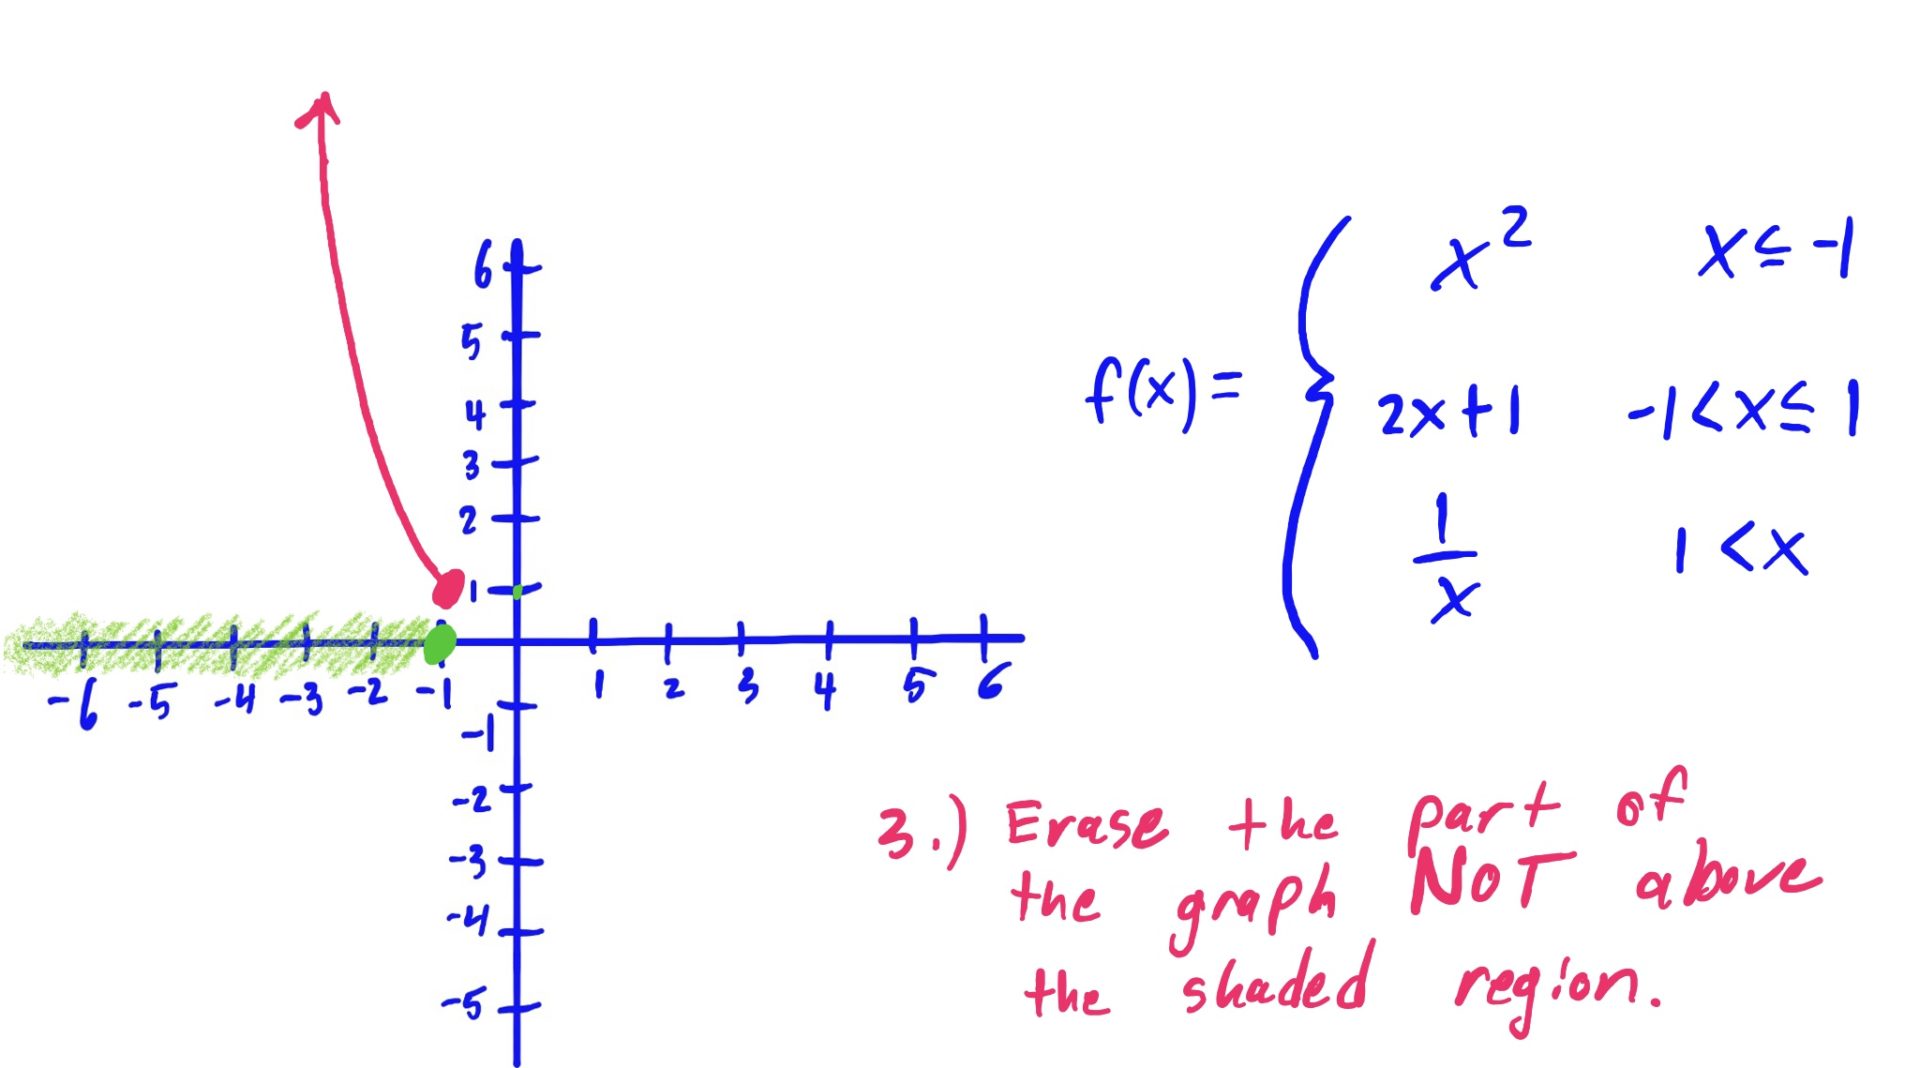
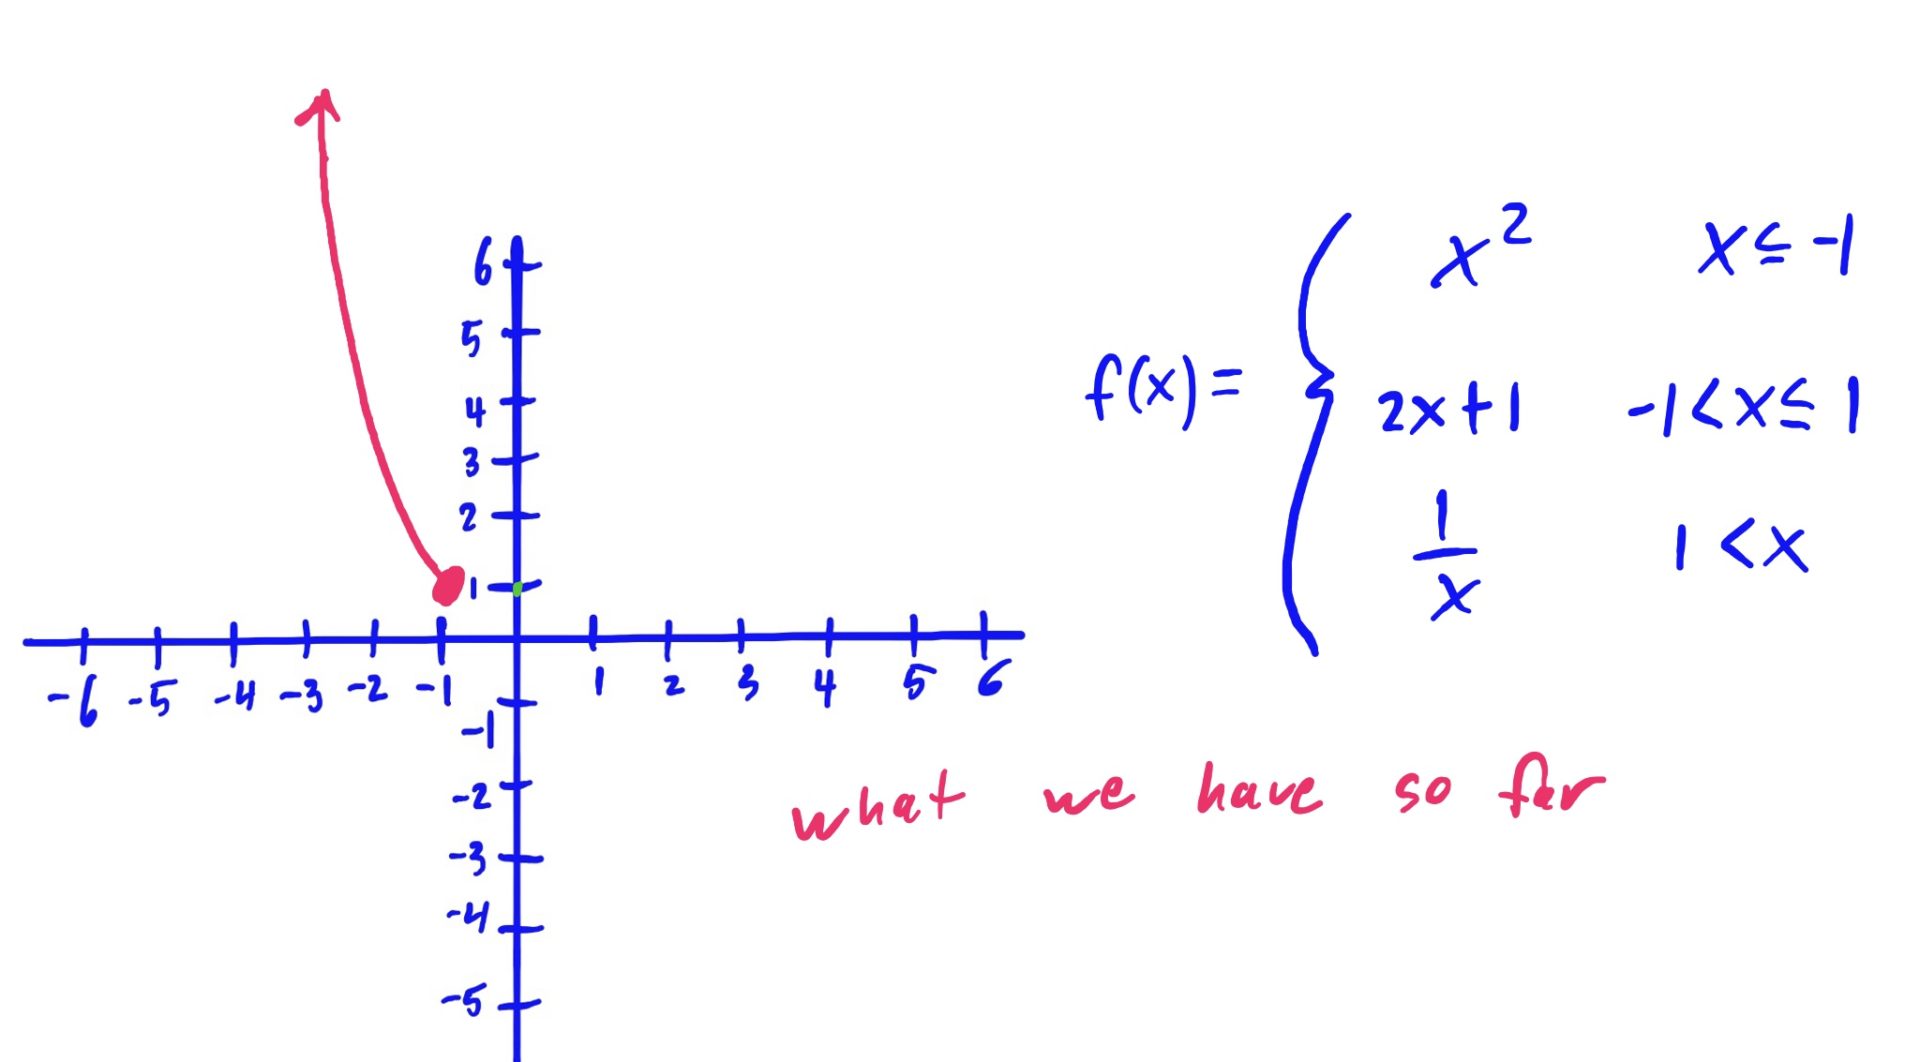
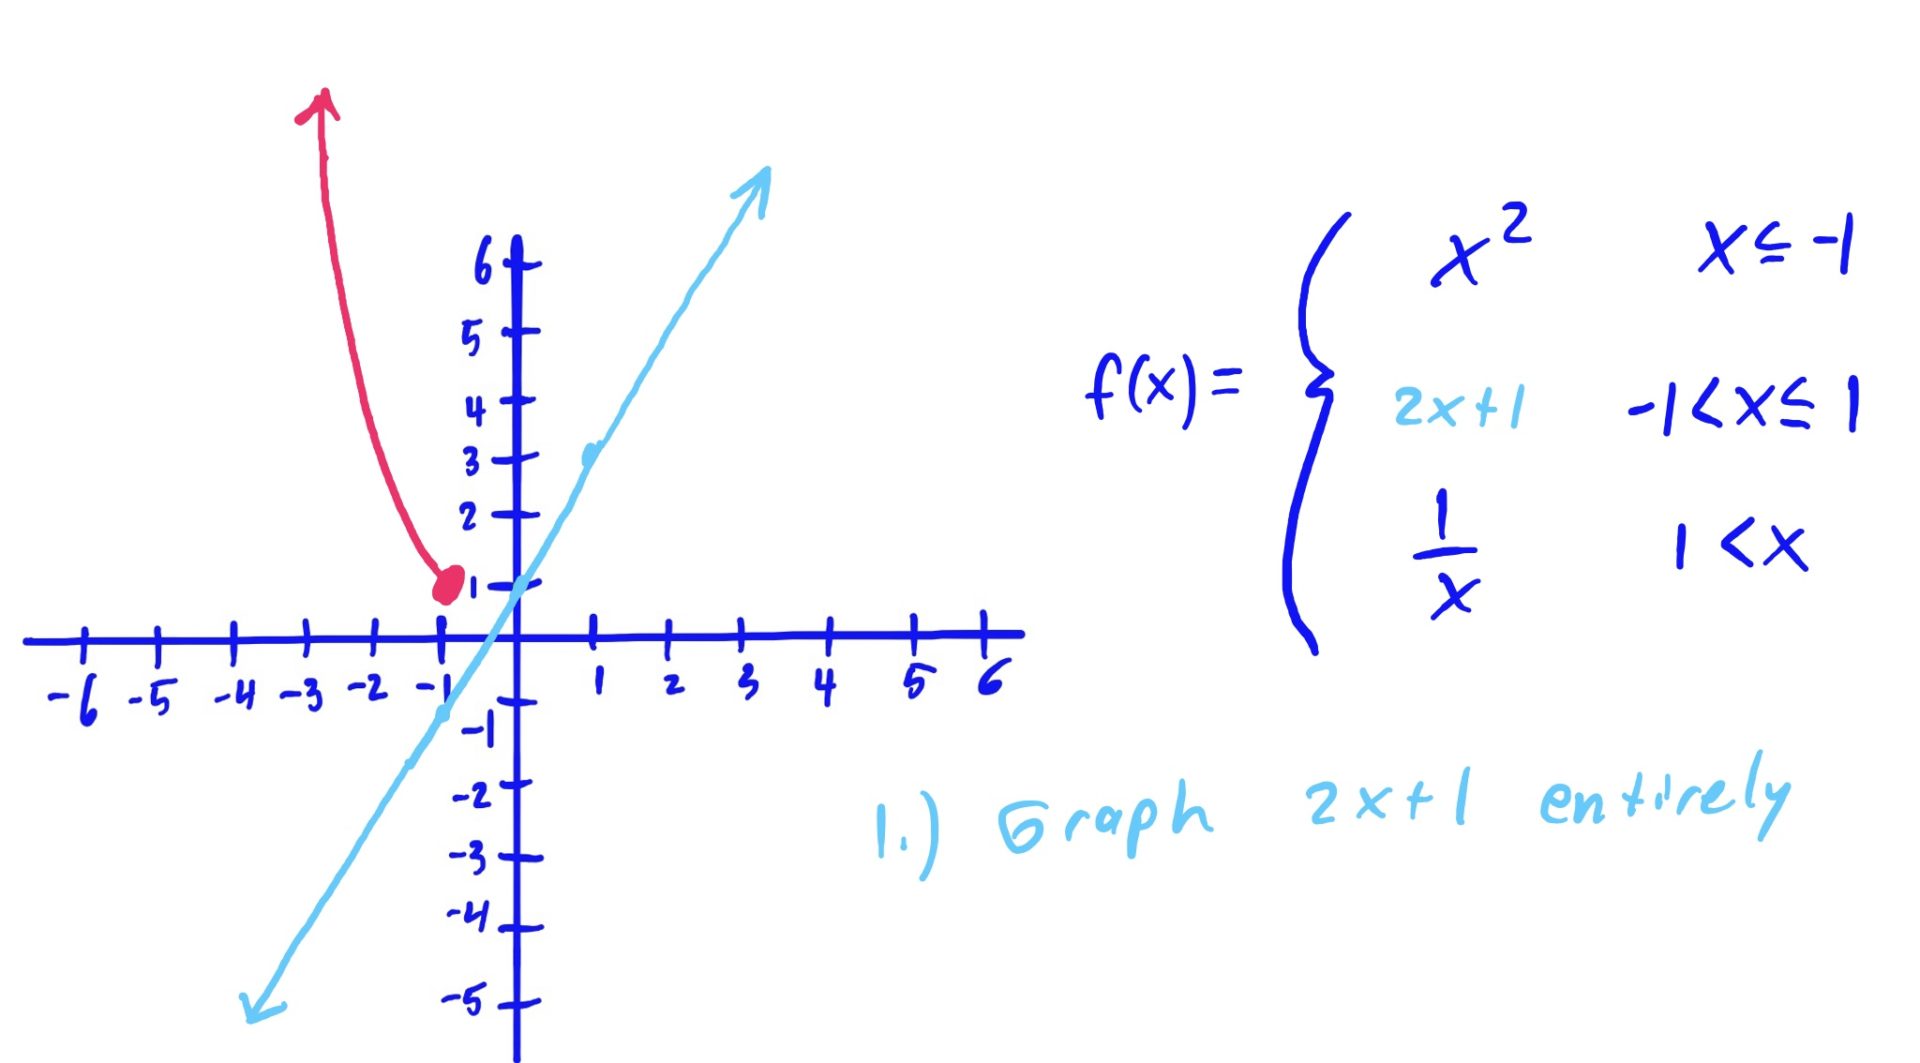
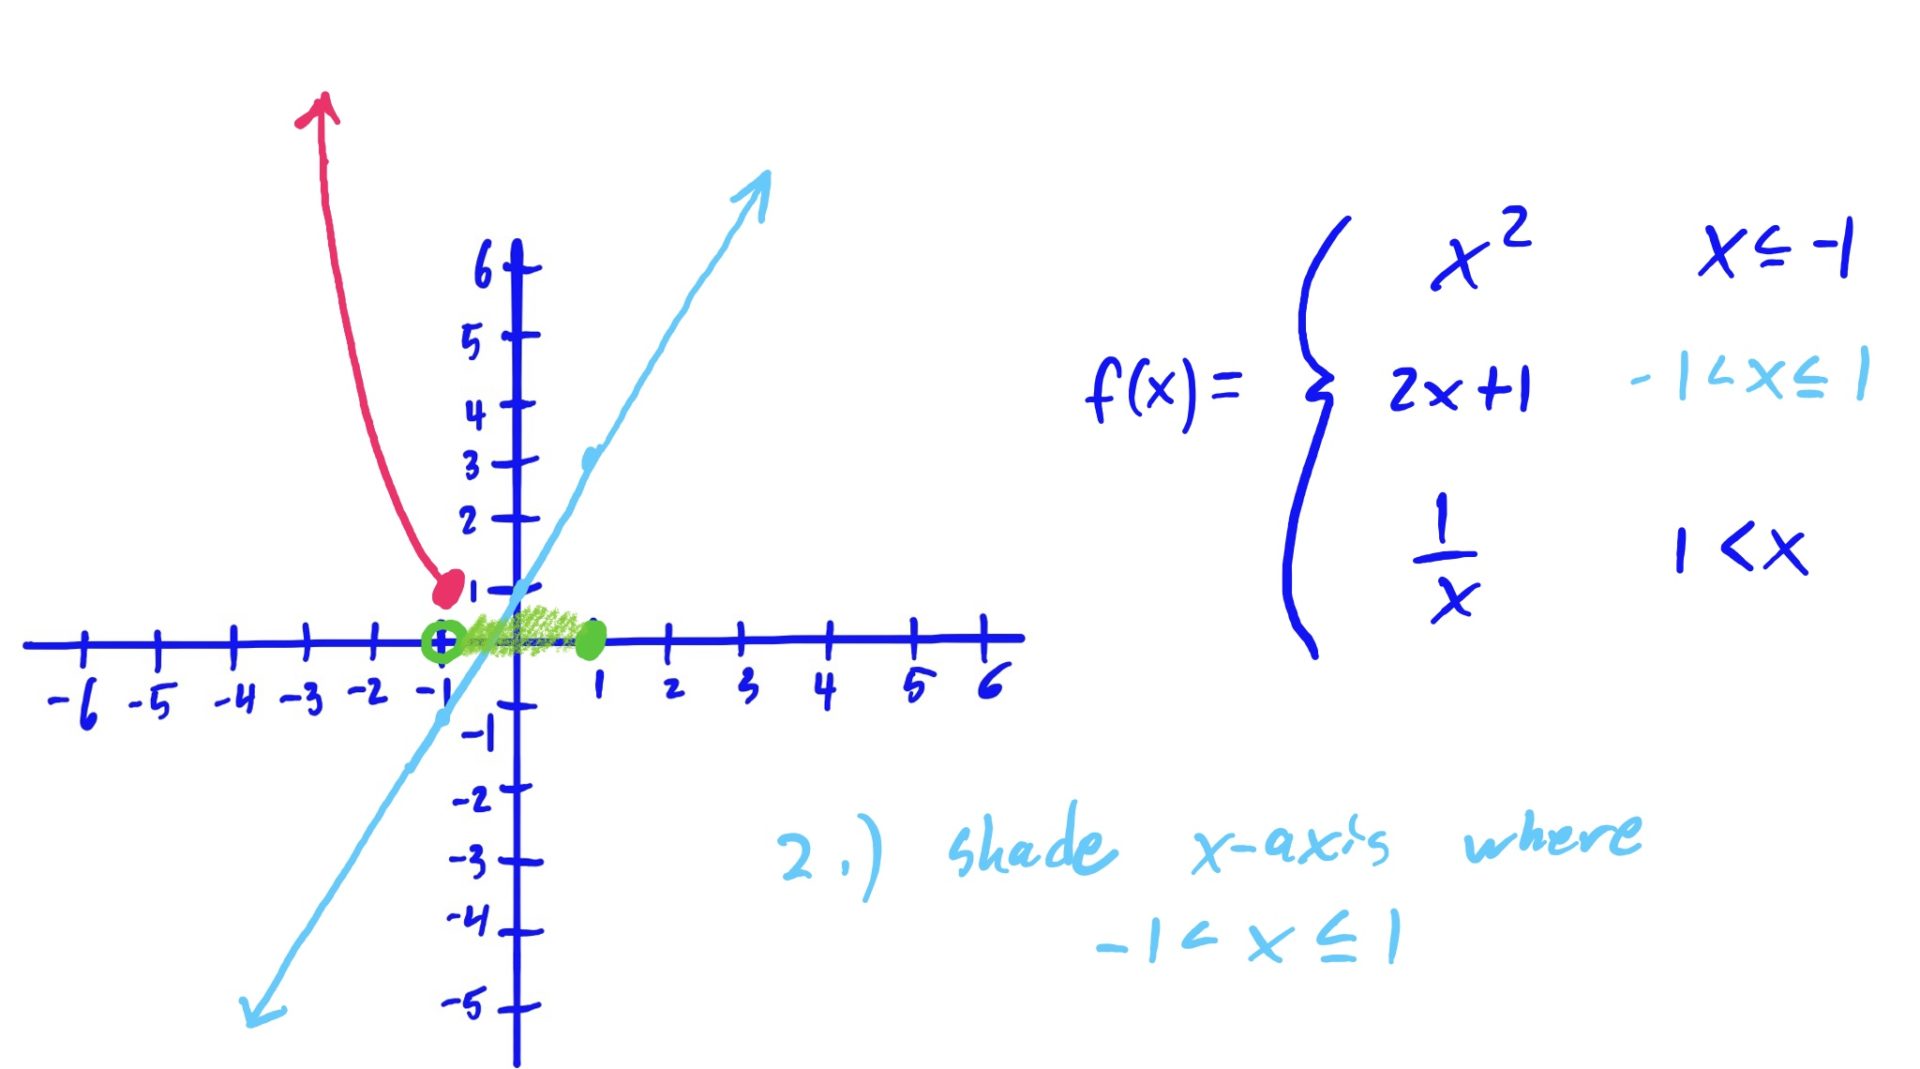
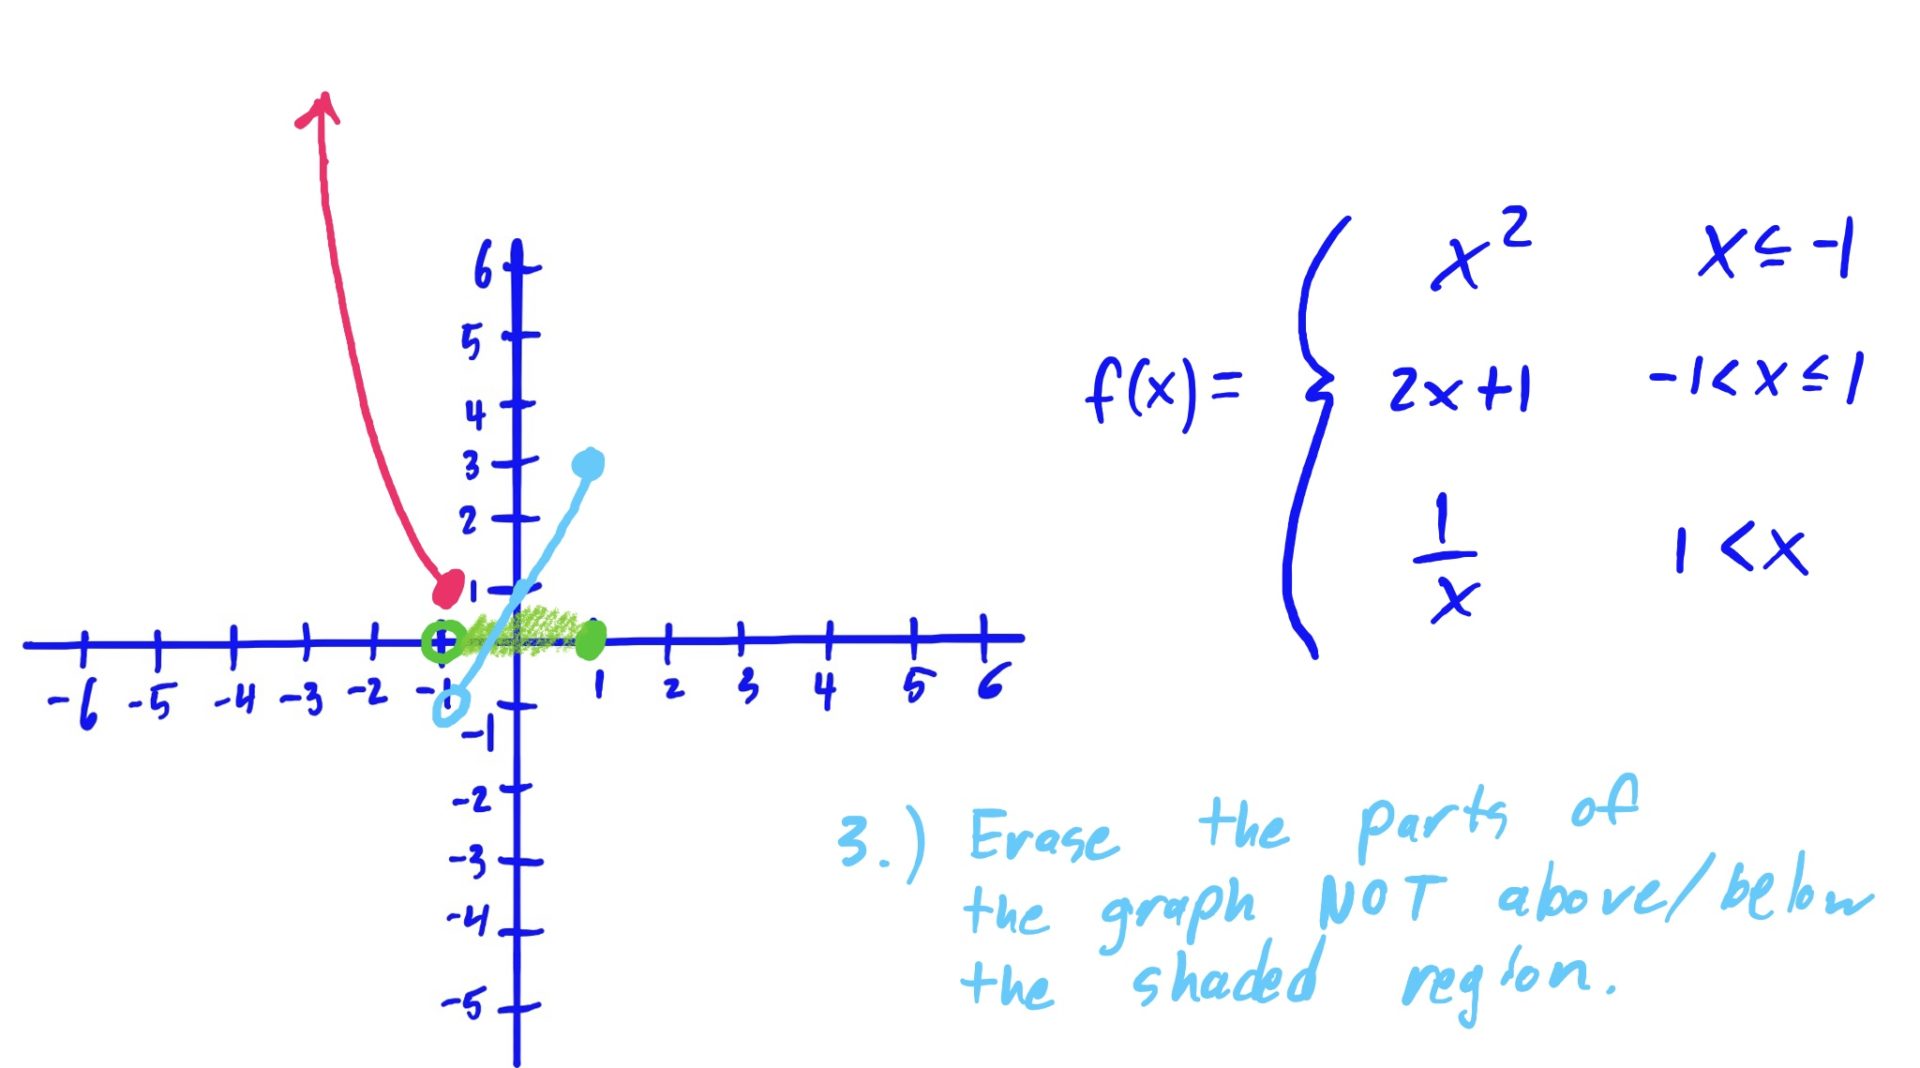
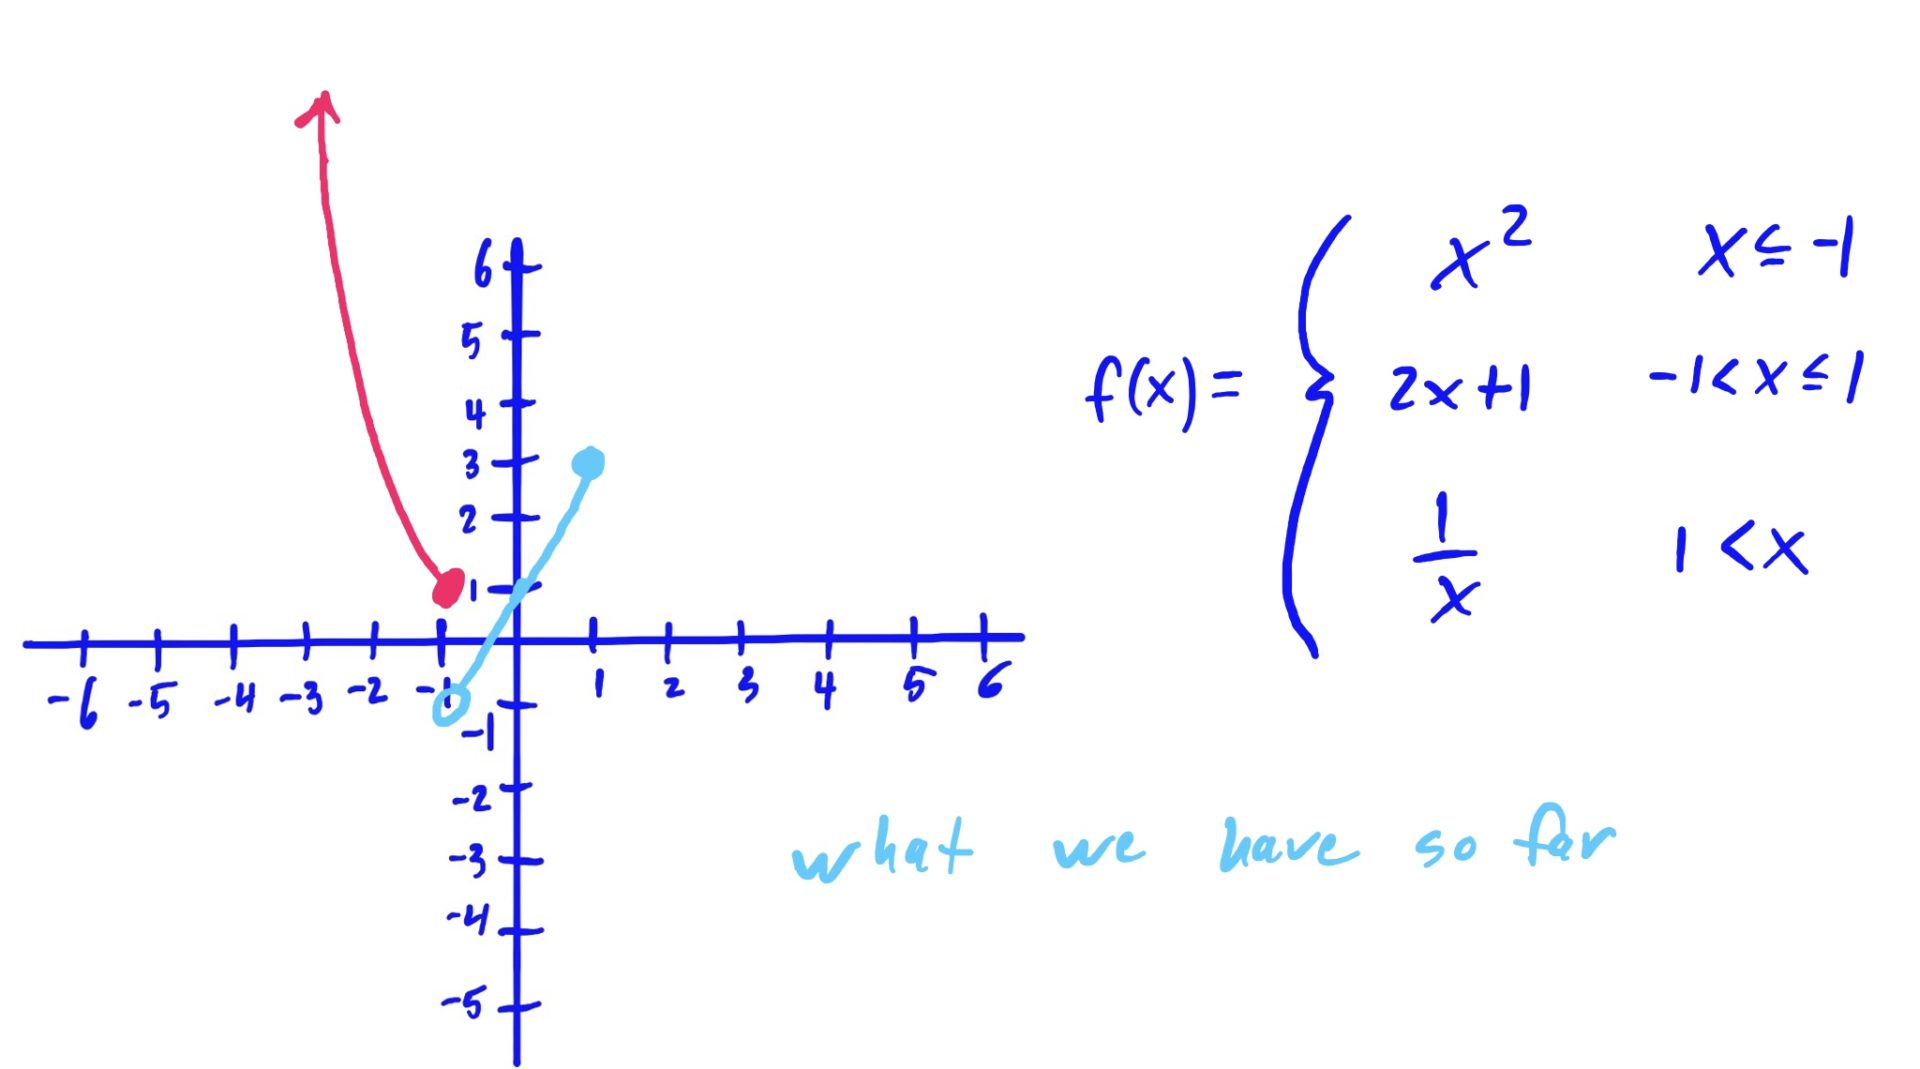
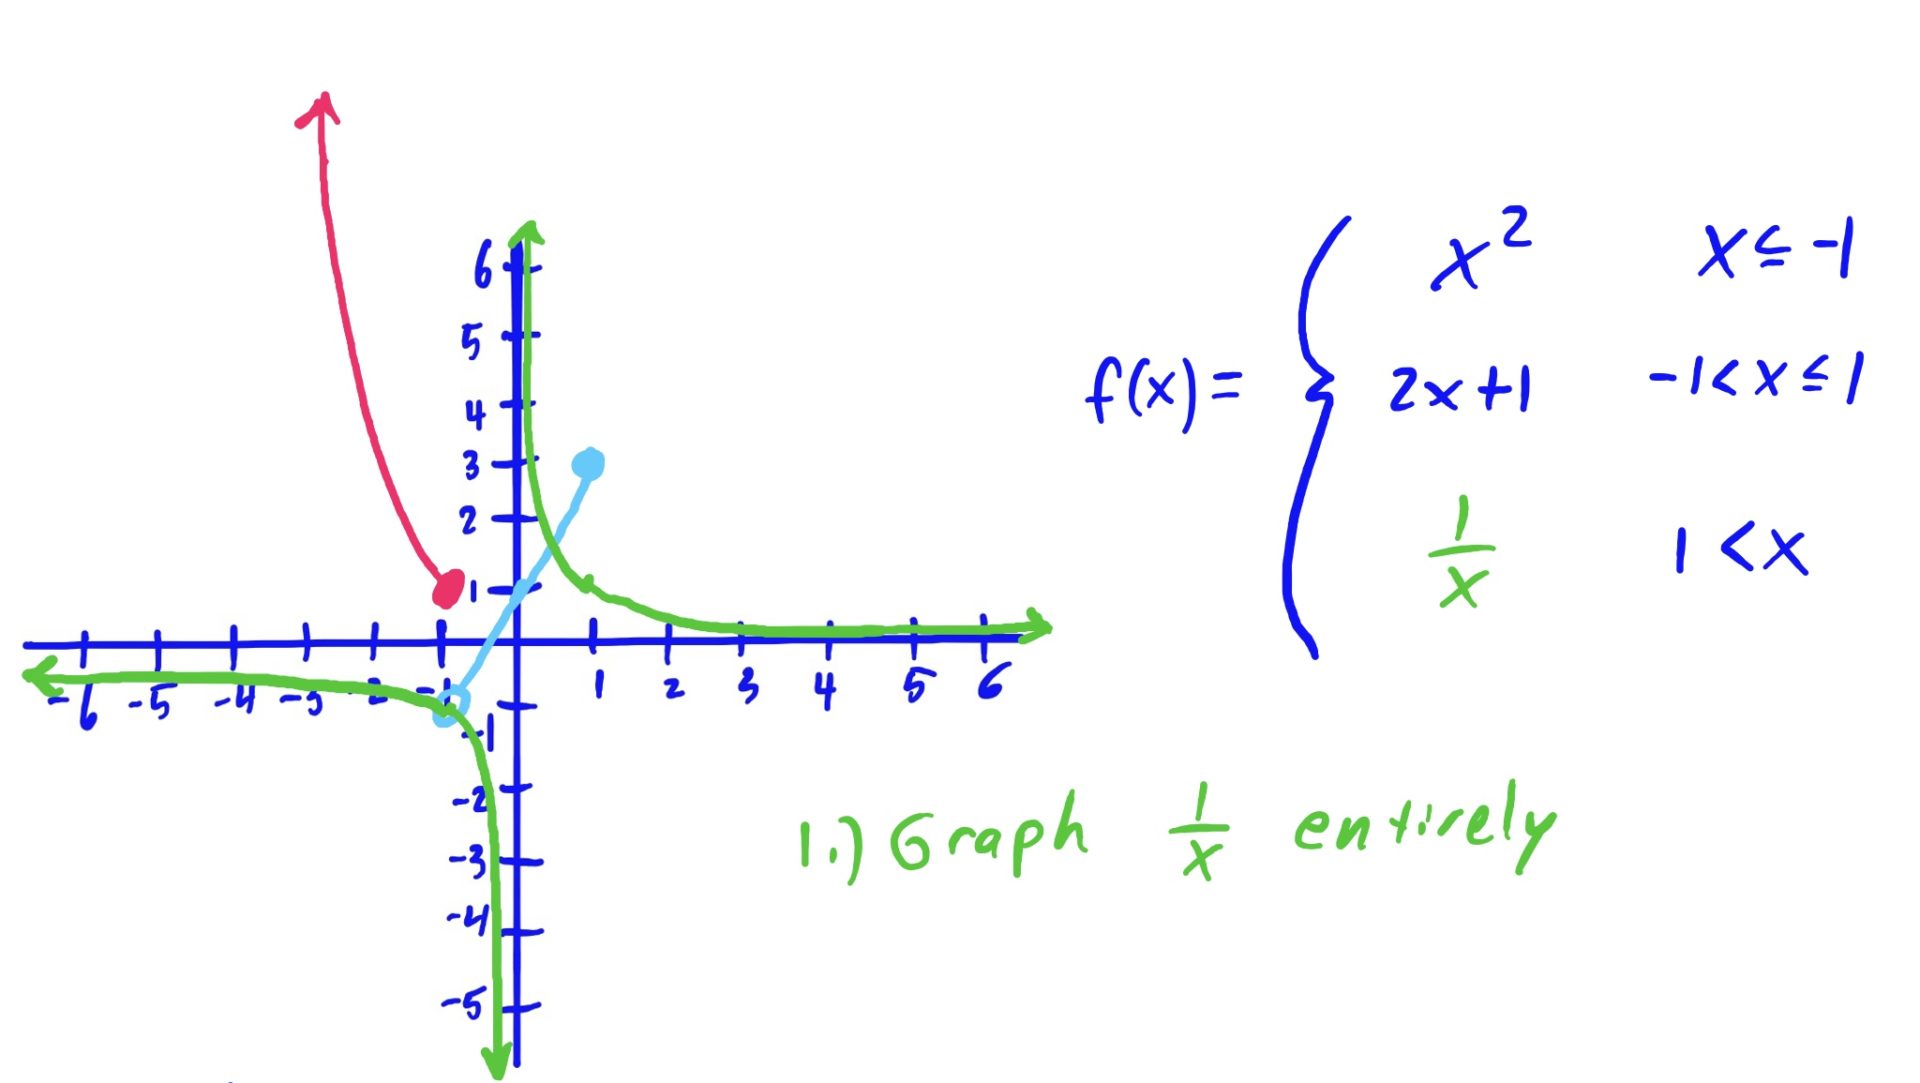
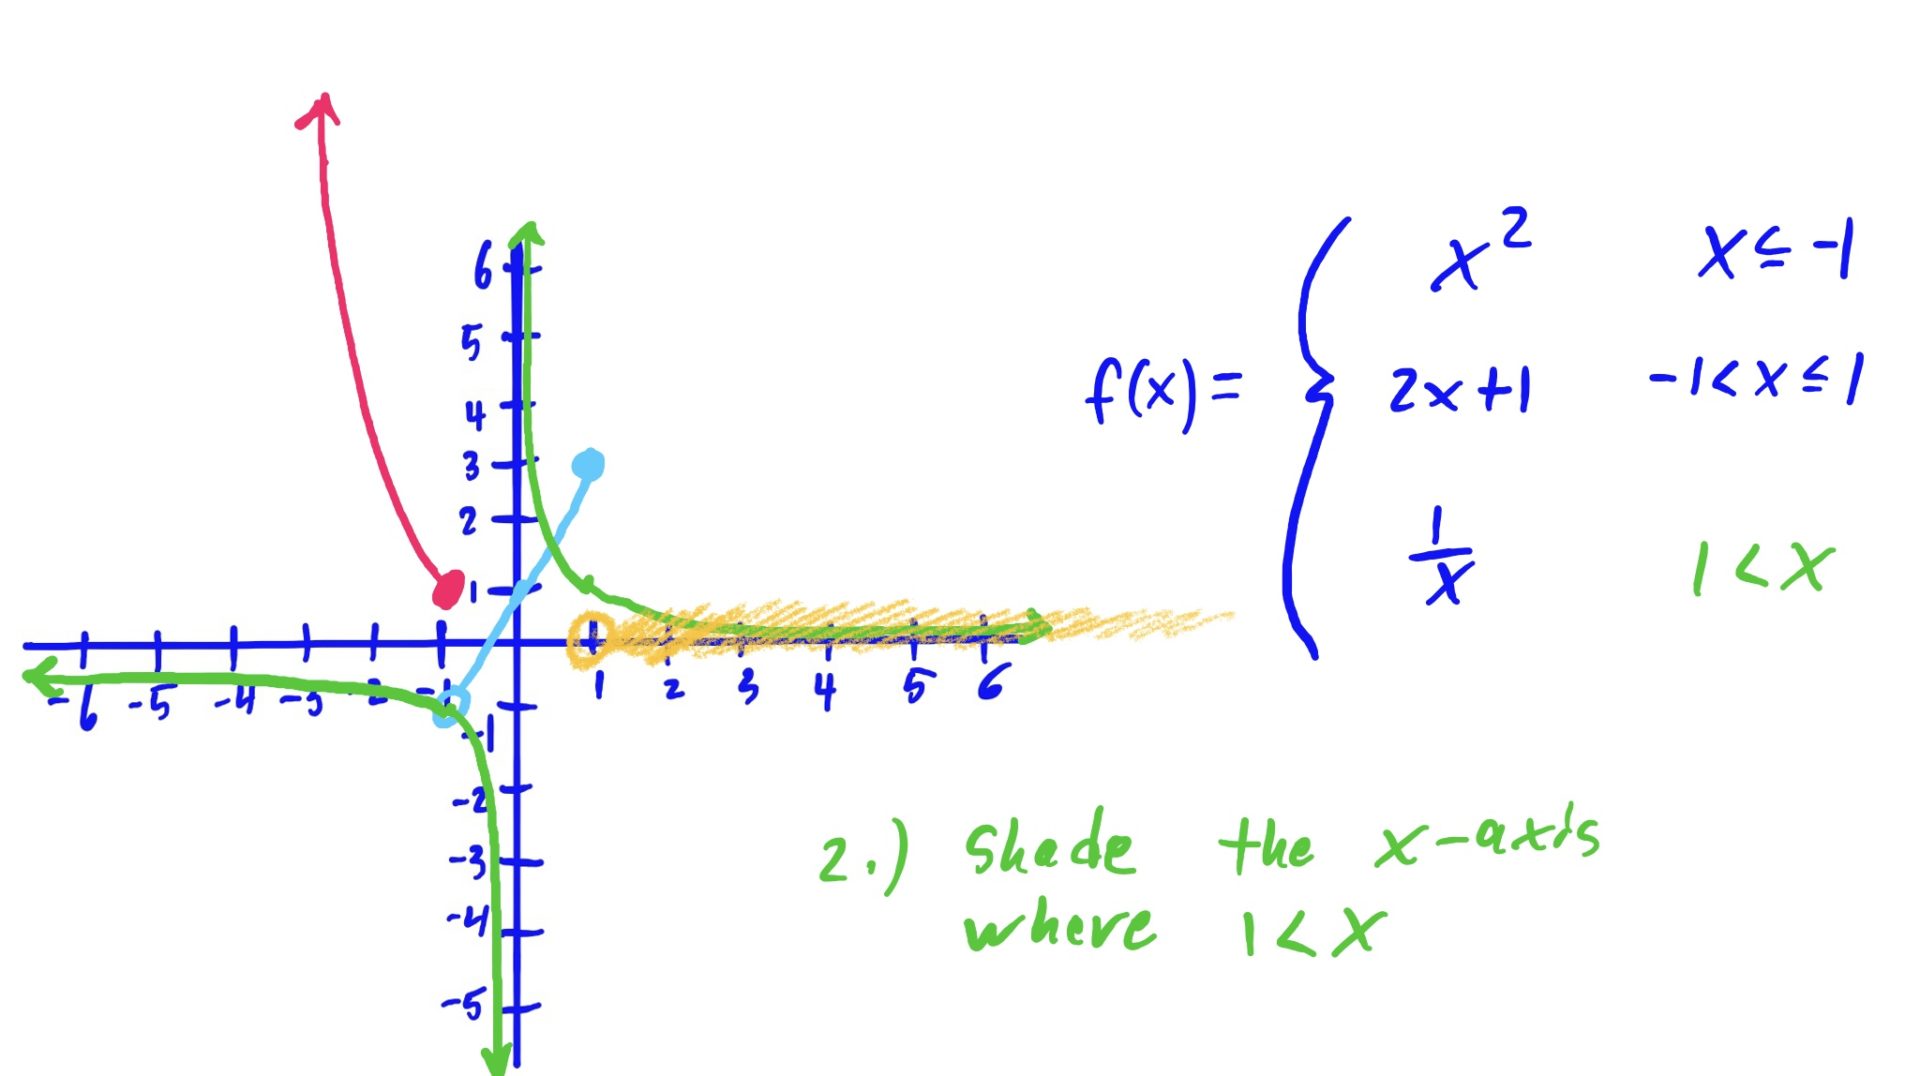
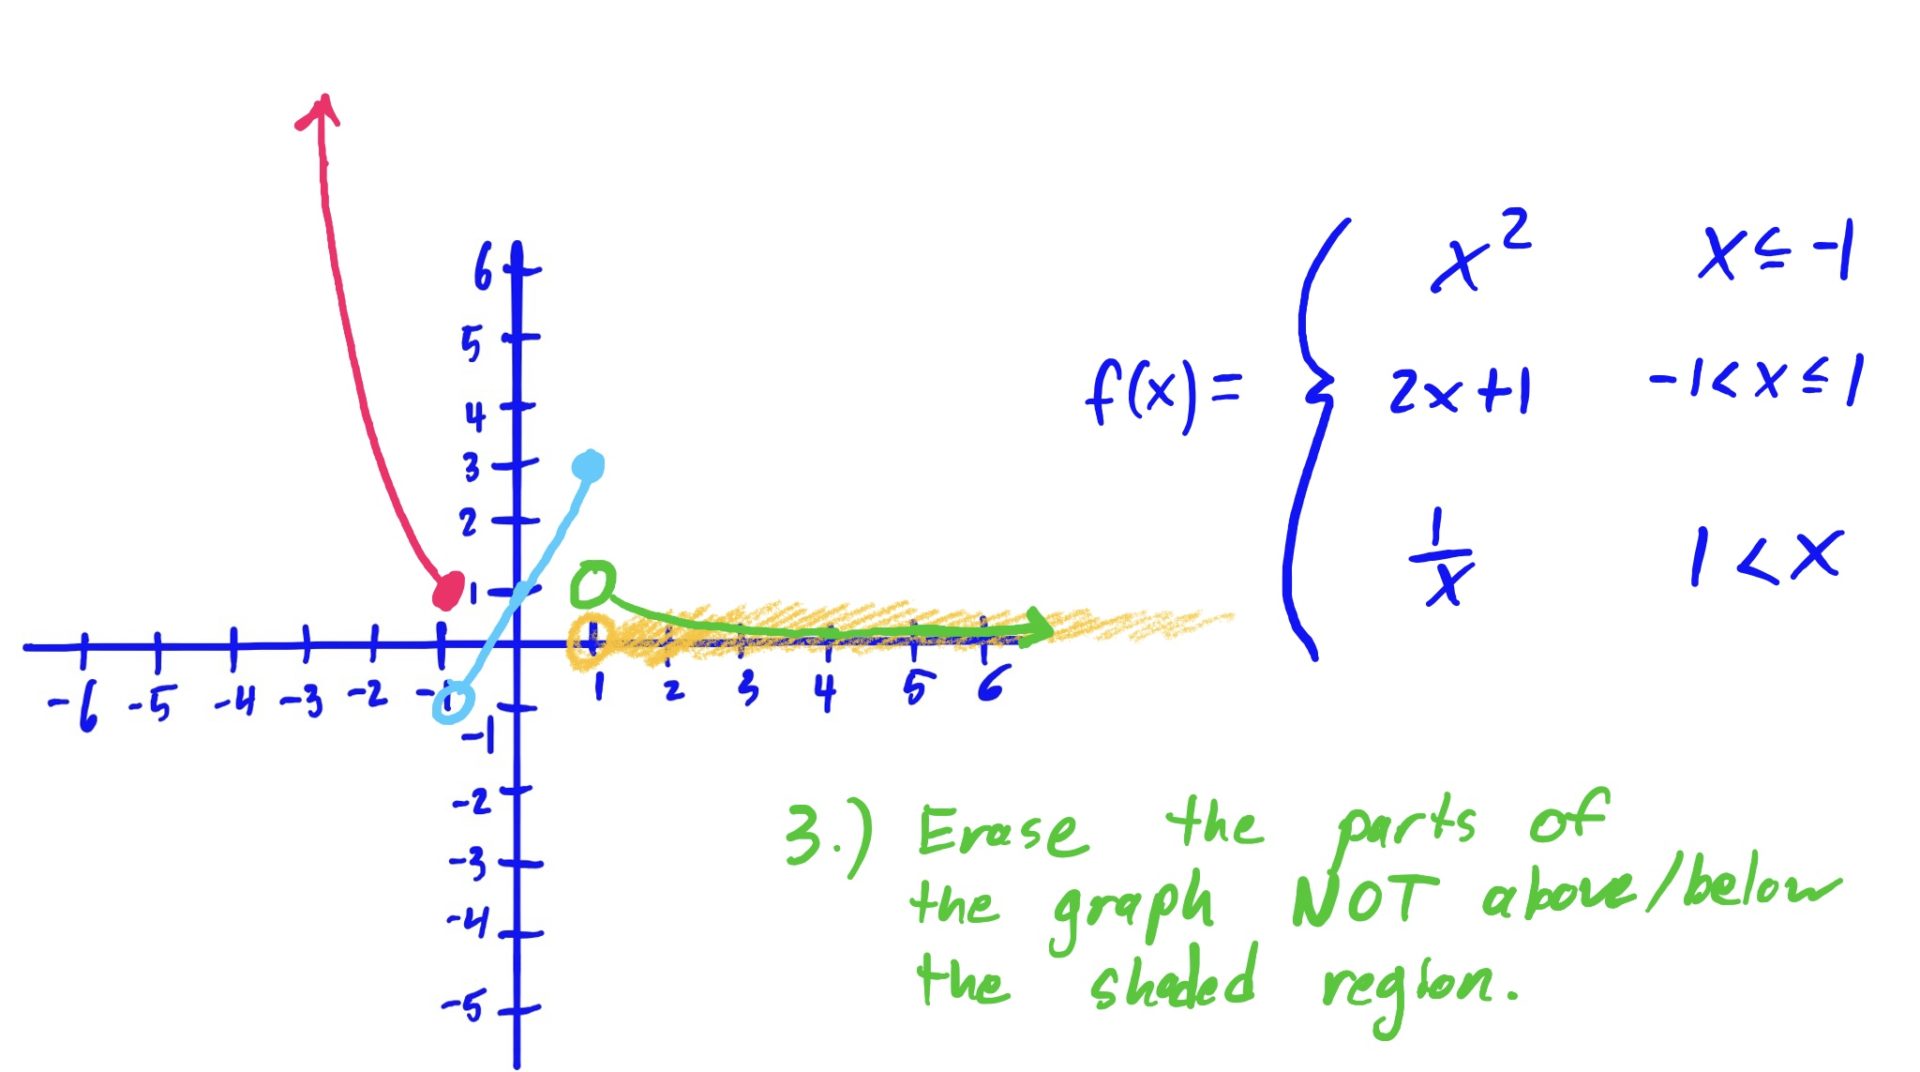
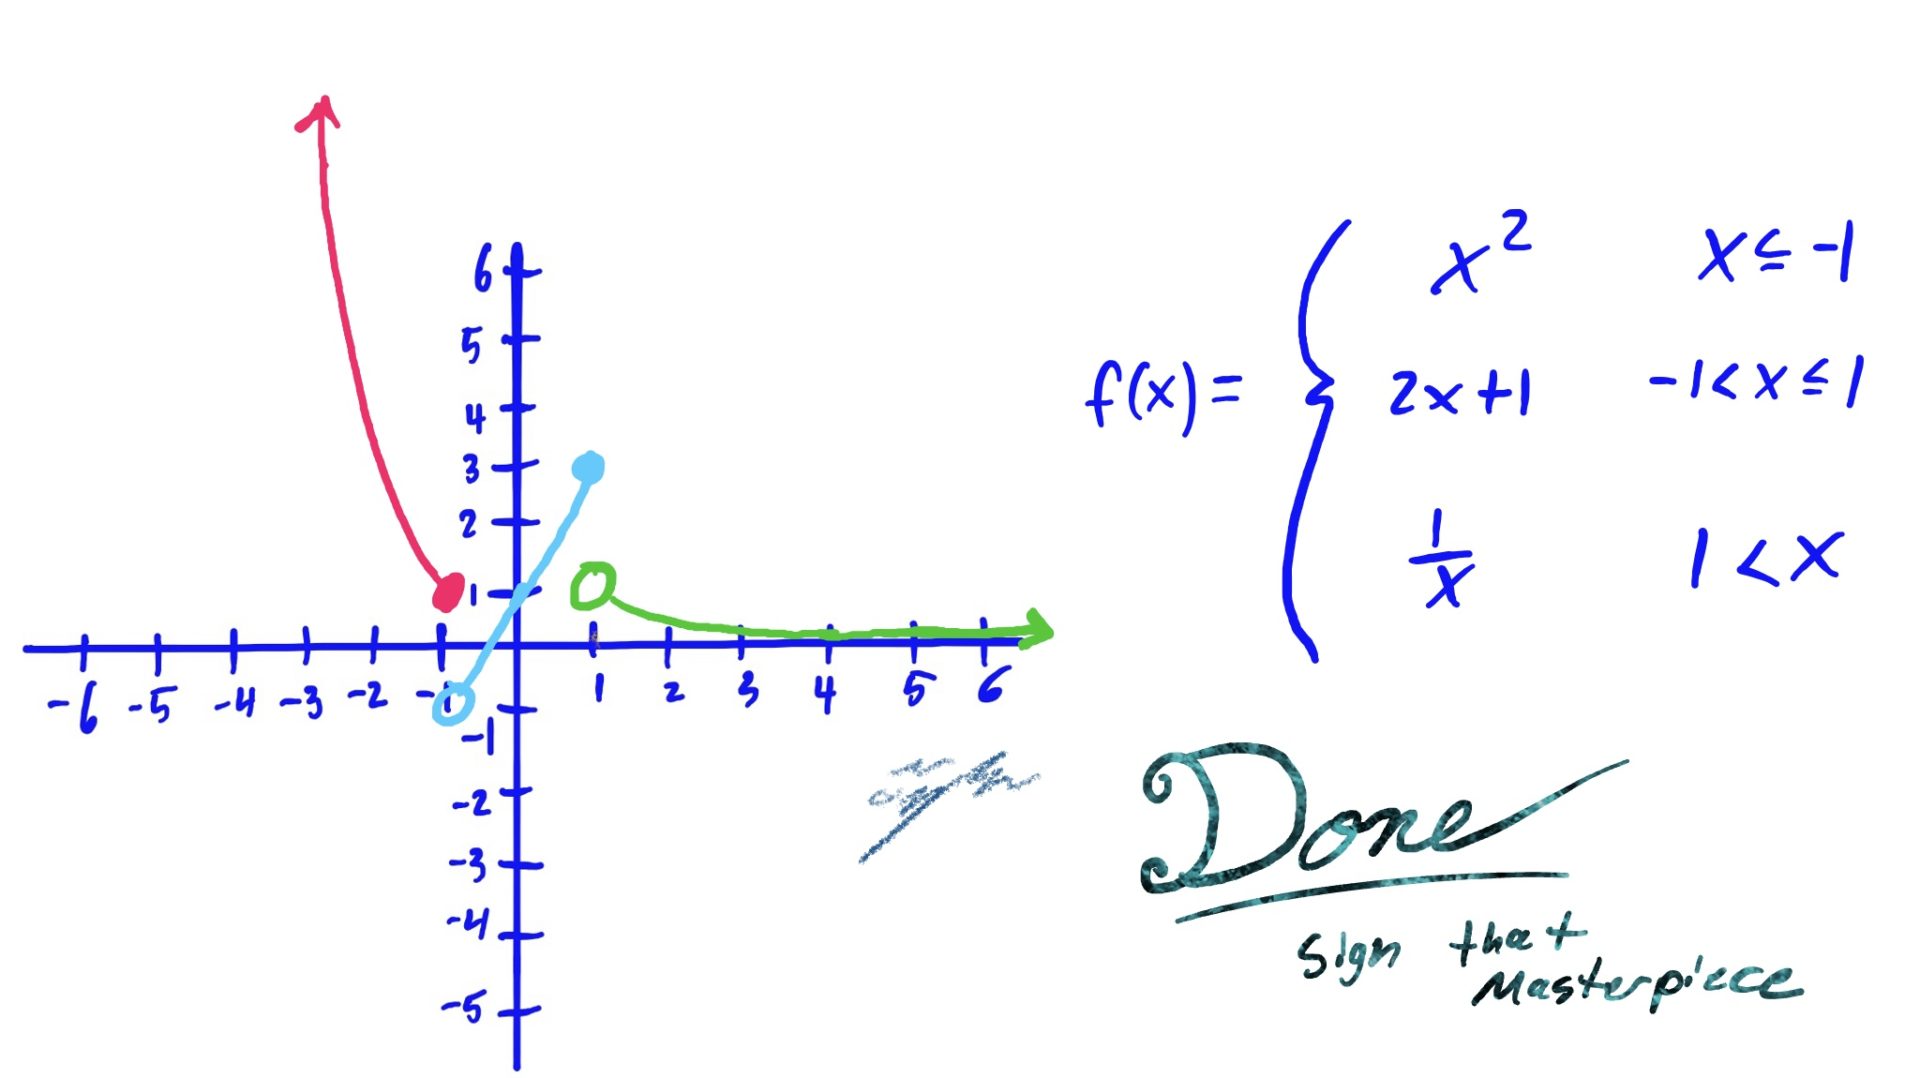
The reason we erase the part of the graph NOT hovering above or below the shaded \(x\)-axis region is because that shaded region is the set of all \(x\)-values for which we use that graphed function to evaluate.
In English, for example (go to the third slide above), because we use the rule \(x^2\) when our input \(x\)-value is \(x\leq -1\), we want to make sure that our graph looks like \(x^2\) only when \(x\leq -1\). So, we erase the other parts of \(x^2\), where \(x\) is NOT less than or equal to \(-1\). Same idea goes for the other rules and shaded regions as well.
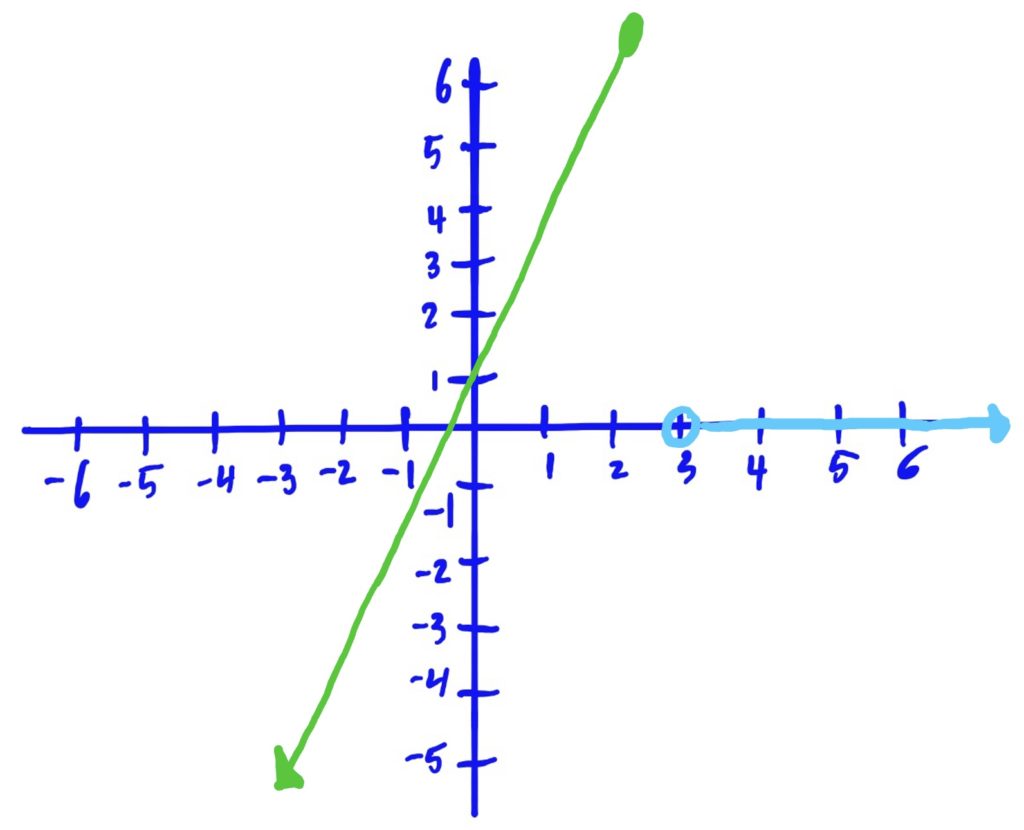
$$
f(x)=\begin{cases}
3x+1 & x<1 \\
0 & 3\leq x
\end{cases}
$$
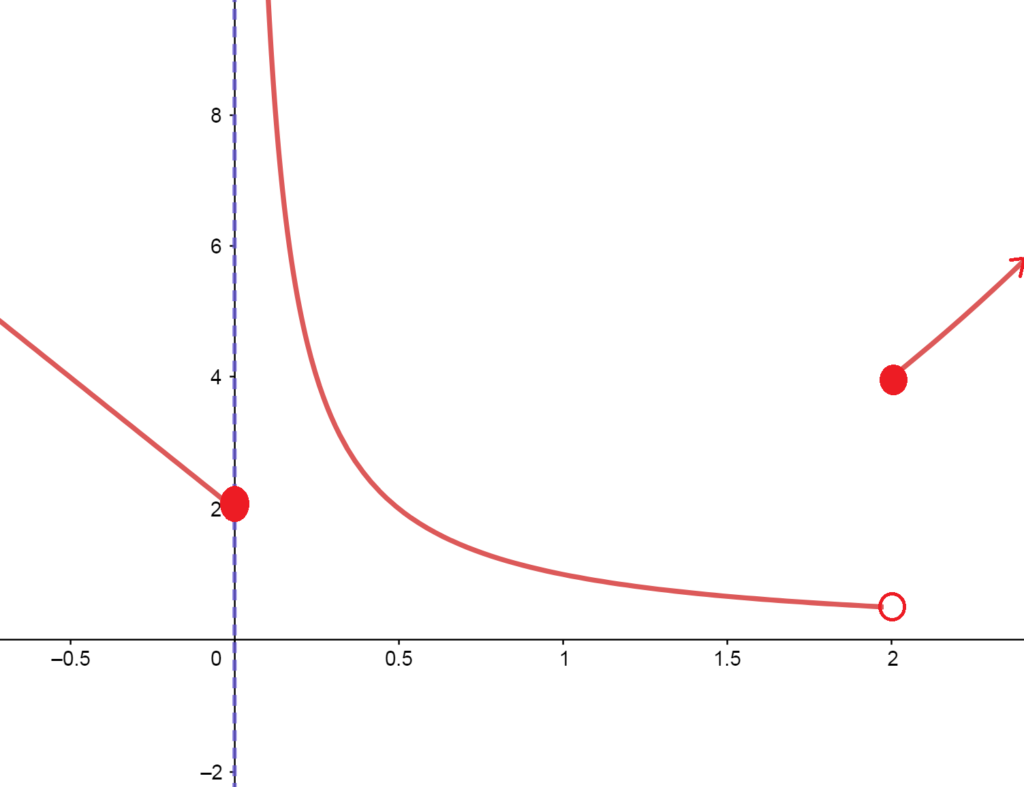
$$
g(x)=\begin{cases}
-4x+2 & x\leq 0 \\
\frac{1}{x} & 0<x<2 \\
x^2 & x\geq 2
\end{cases}
$$
$$
f(x)=\begin{cases}
0 & x\leq -1 \\
\frac{1}{1-x} & -1< x< 1 \\
x^2+1 & 1\leq x
\end{cases}
$$
