Finding Domains and Ranges Using Graphs of Functions
Domains and Ranges of Graphs
Finding Domains of Functions Defined by Graphs
To find the domain of a function defined by a graph, treat the \(x\)-axis as a number line that the graph is “floating over/under.” The shadow/projection of the graph on the \(x\)-axis is the domain of the function. See the example function below.
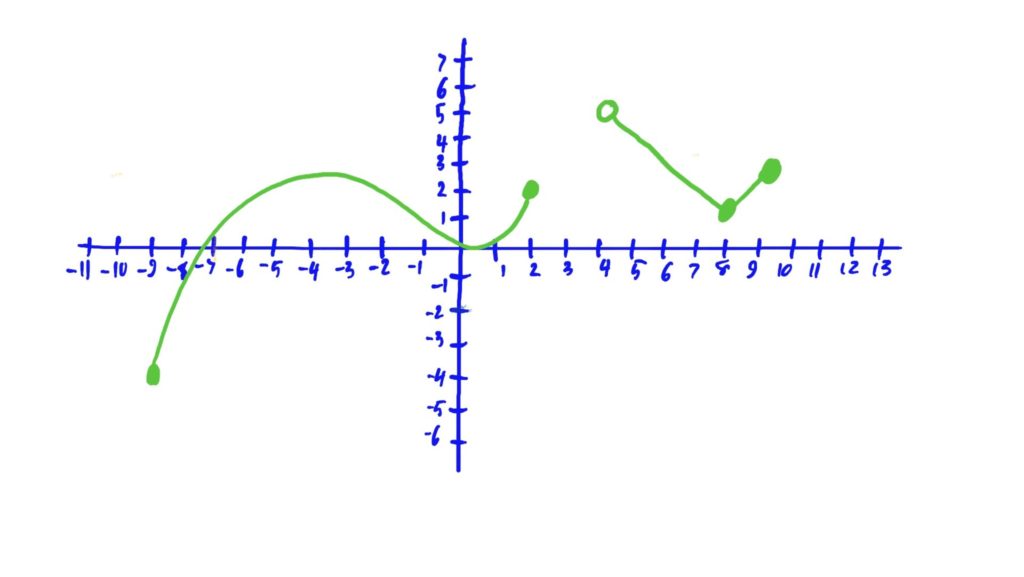
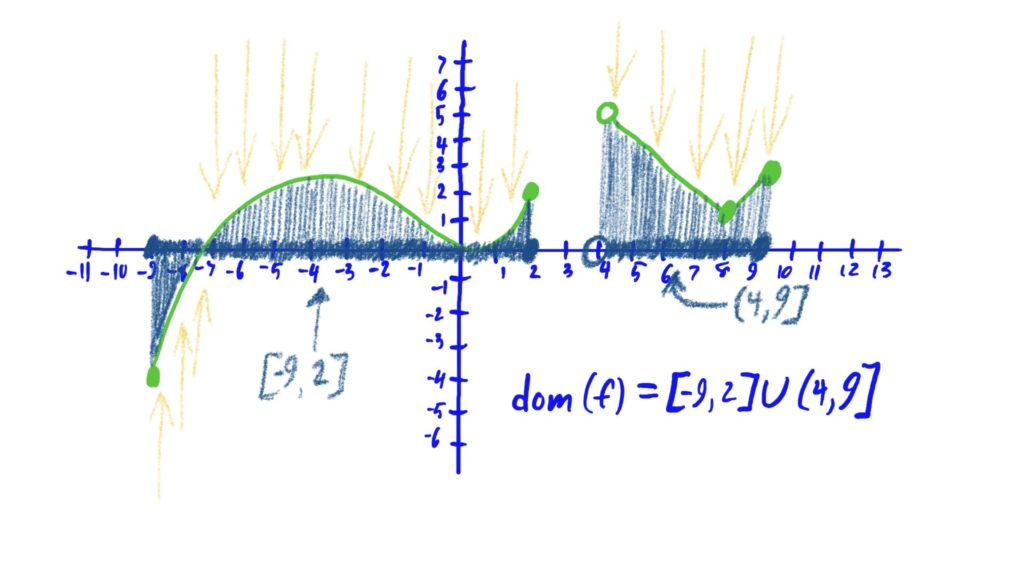
Imagine that there is light shining above and below the graph of the function in question. The “shadow” created by the graph along the \(x\)-axis represents the function’s domain, i.e. the set of all \(x\)-values that have an associated \(y\)-value via this function/graph. Notice that no “shadow” is cast on the \(x\)-axis where the function is not defined (i.e. where there are no \(y\)-values associated with a collection of \(x\)-values).
Finding Ranges of Functions Defined by Graphs
To find the range of a function defined by a graph, treat the \(y\)-axis as a number line that the graph is “floating to the left and right of.” The shadow/projection of the graph (as if shining a light from the left and right of the graph) along the \(y\)-axis is the range of the function. See the graph below for how this “shadow casting” method works.

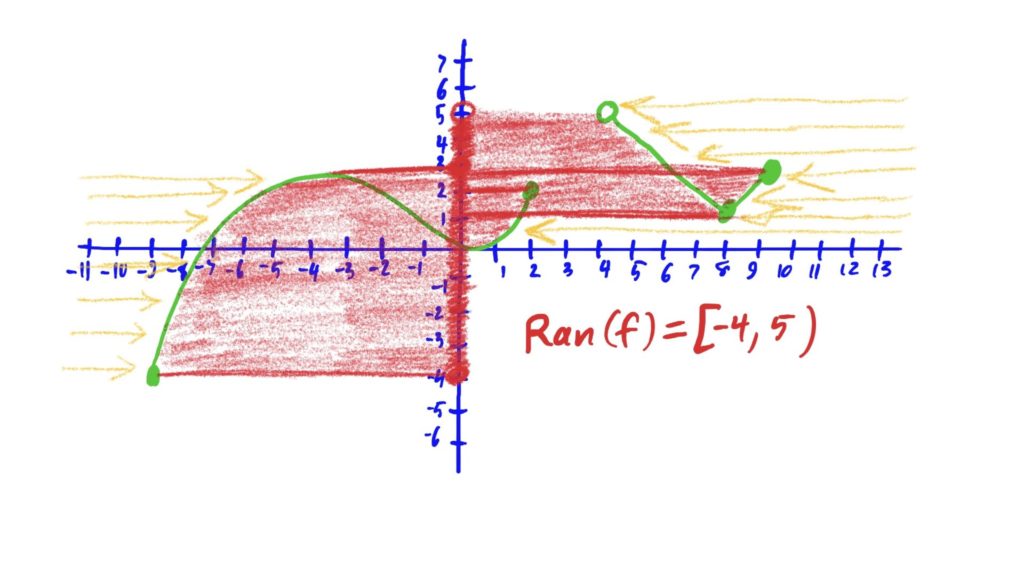
The above may look confusing, but the key idea here is to “cast a shadow” from the left and from the right of the graph, and see where the shadow lies. In this case, we see that this shadow is the darkly shaded region along the \(y\)-axis. This region is the function’s range.
Remember that the range of a function are all possible \(y\)-values that can be produced by the function. This “shadow casting” method helps you see which \(y\)-values these are as a shaded region on the \(y\)-axis.
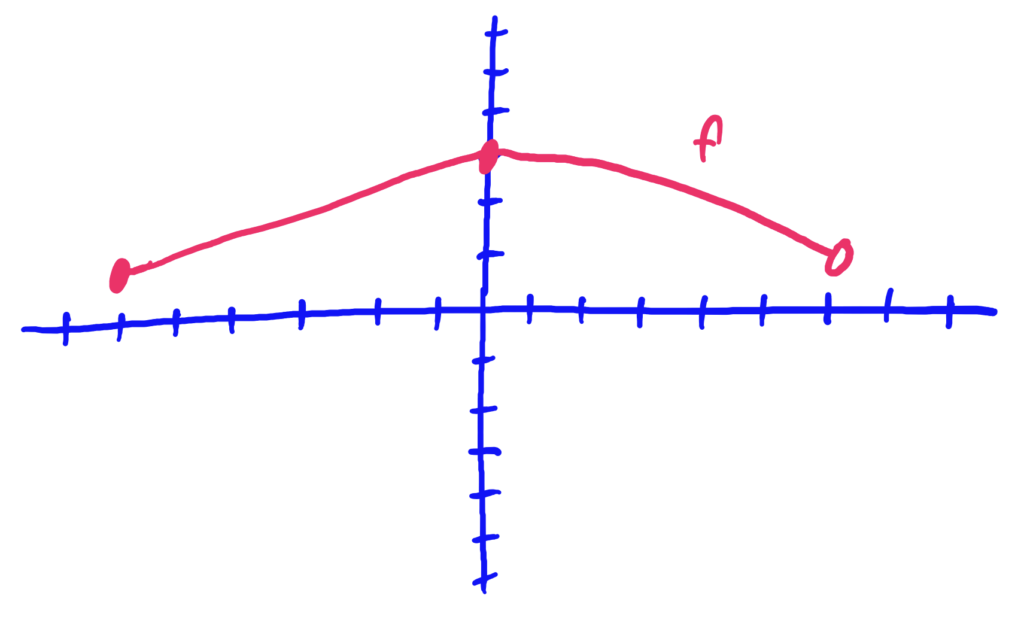
dom\((f)=[-6,6)\), ran\((f)=[1,3]\)
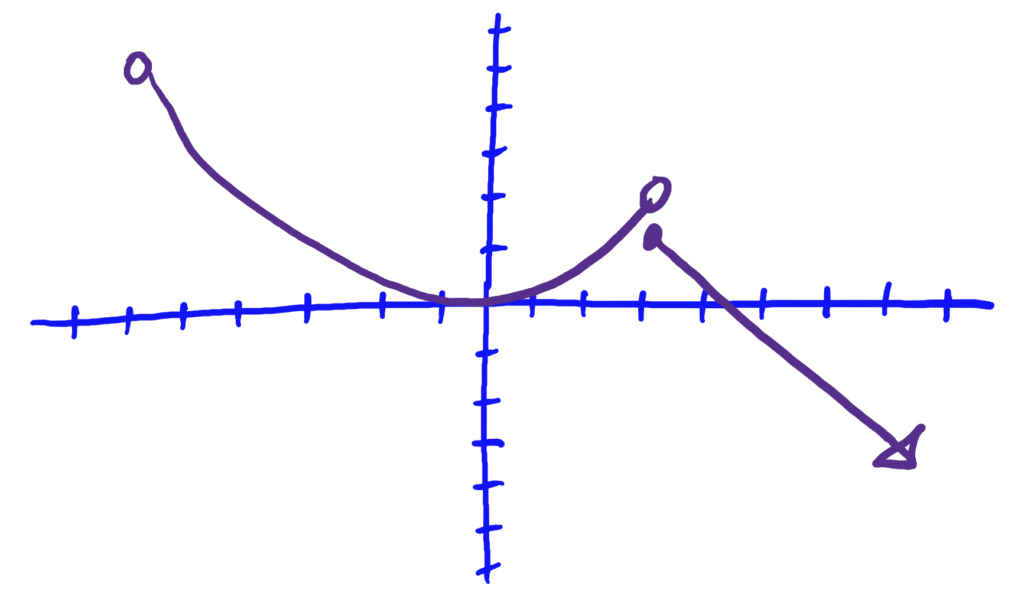
dom\((f)=(-6,\infty)\), ran\((f)=(-\infty,5)\)
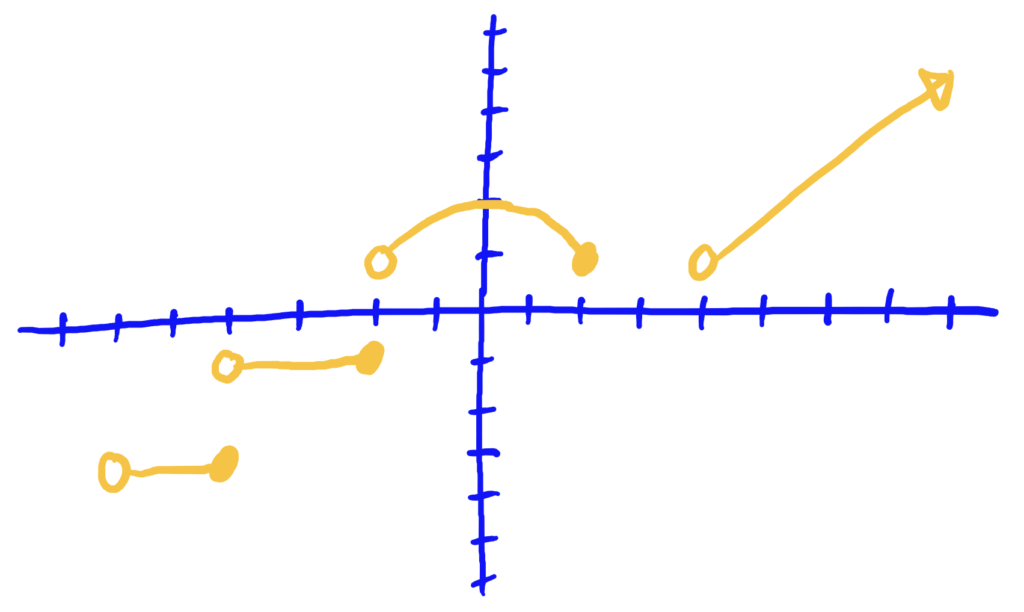
dom\((f)=(-6,2]\cup (4,\infty)\), ran\((f)=\{-4,-1\}\cup [1,2]\cup (1,\infty)\)
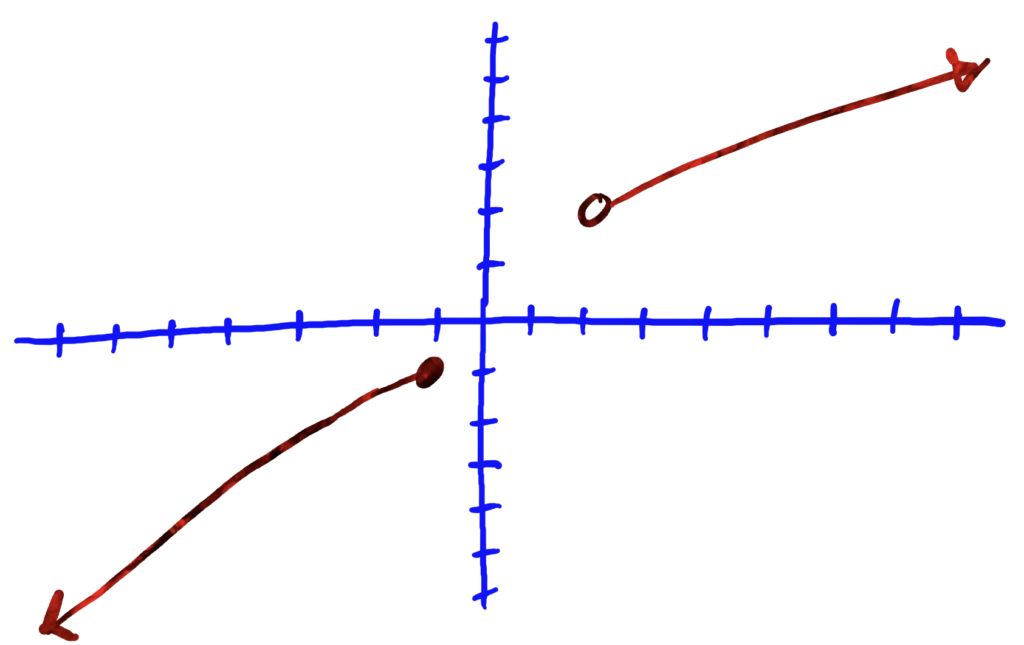
dom\((f)=(-\infty,-1]\cup (2,\infty)\), ran\((f)=(-\infty,-1]\cup (2,\infty)\)
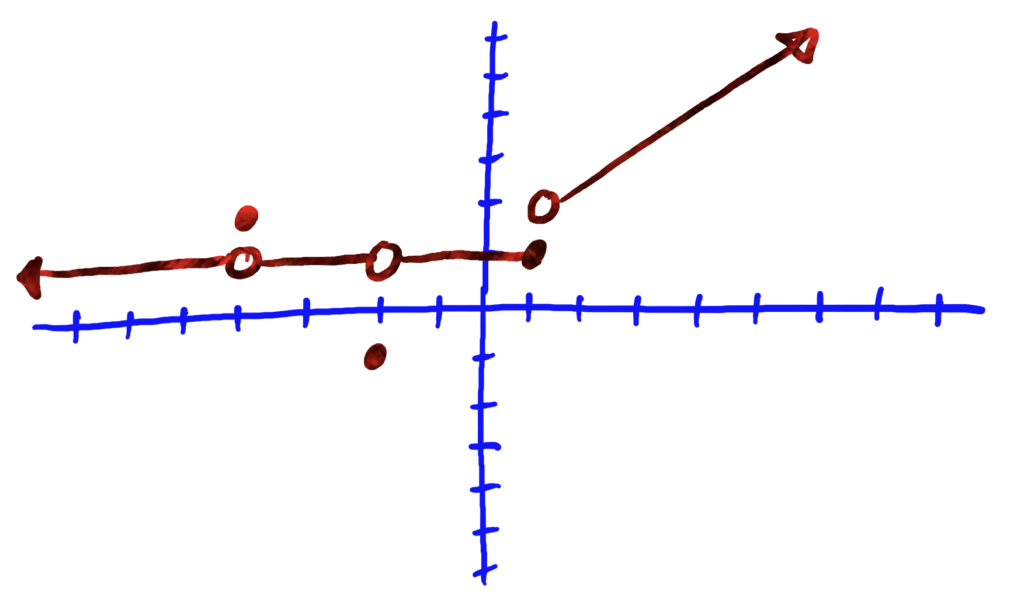
Solution: dom\((f)=(-\infty,\infty)\), ran\((f)=\{-1,1\}\cup [2,\infty)\)
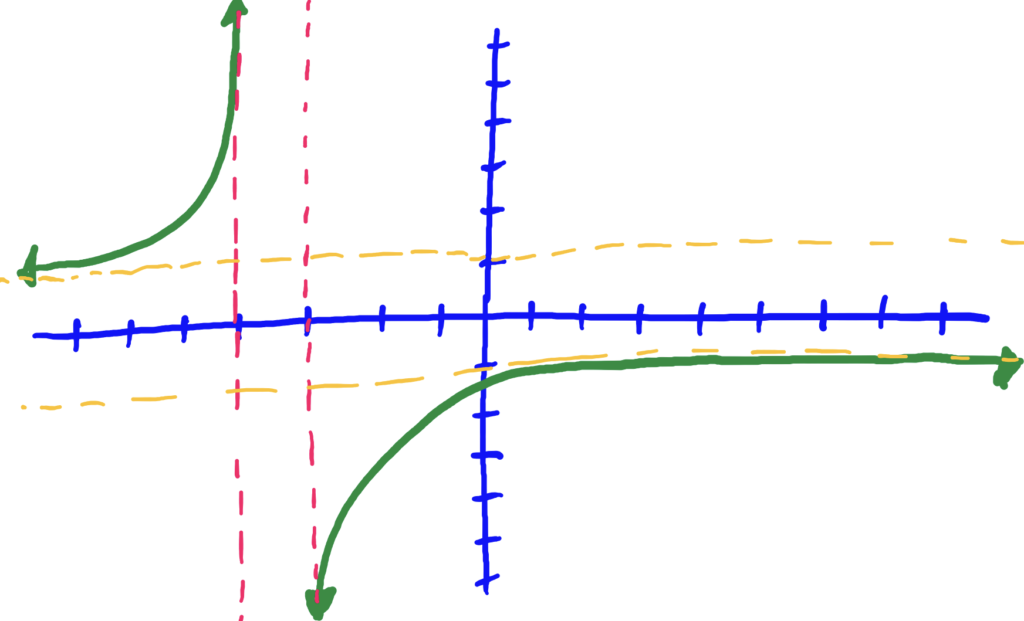
dom\((f)=(-\infty,-4)\cup (-3,\infty)\), and ran\((f)=(-\infty,-1)\cup (1,\infty)\)
